

N Tull, JC Dietrich+, TE Langan, H Mitasova, CA Rucker, BO Blanton, JG Fleming, RA Luettich. “Downscaling and Extrapolation of Coastal Flooding Forecasts for Decision Support.” Geospatial Forum, Center for Geospatial Analytics, North Carolina State University, Raleigh, North Carolina, 18 October 2018.
Category Archives: NC Sea Grant 2014-2016
Presentation: NC Sea Grant Site Review
Dissertation Defense: Rosemary Cyriac
Variability in Coastal Flooding Predictions due to Forecast Errors during Hurricane Arthur
 Storm surge prediction models rely on an accurate representation of the wind conditions. In this paper, we examine the sensitivity of surge predictions to forecast uncertainties in the track and strength of a storm (storm strength is quantified by the power dissipation of the associated wind field). This analysis is performed using Hurricane Arthur (2014), a Category 2 hurricane, which made landfall along the North Carolina (NC) coast in early July 2014. Hindcast simulations of a coupled hydrodynamic-wave model are performed on a large unstructured mesh to analyze the surge impact of Arthur along the NC coastline. The effects of Arthur are best represented by a post-storm data assimilated wind product with parametric vortex winds providing a close approximation. Surge predictions driven by forecast advisories issued by the National Hurricane Center (NHC) during Arthur are analyzed. The storm track predictions from the NHC improve over time. However, successive advisories predict an unrealistic increase in the storm’s strength. Due to these forecast errors, the global root mean square errors of the predicted wind speeds and water levels increase as the storm approaches landfall. The relative impacts of the track and strength errors on the surge predictions are assessed by replacing forecast storm parameters with the best known post-storm information about Arthur. In a “constant track” analysis, Arthur’s post storm determined track is used in place of the track predictions of the different advisories but each advisory retains its size and intensity predictions. In a “constant storm strength” analysis, forecast wind and pressure parameters are replaced by corresponding parameters extracted from the post storm analysis while each advisory retains its forecast storm track. We observe a strong correlation between the forecast errors and the wind speed predictions. However, the correlation between these errors and the forecast water levels is weak signifying a non-linear response of the shallow coastal waters to meteorological forcing.
News: Improving Coastal Flooding Predictions
2018/05/14 – NC Sea Grant Coastwatch Currents
Hurricane Hindsight: Researchers Work to Improve Coastal Flooding Predictions
Hurricane Hindsight: Researchers Work to Improve Coastal Flooding Predictions

Computer models can make surge predictions based on limited information about storm characteristics such as track, size, maximum wind speed and central pressure. Those parameters are used to predict the surface pressures and wind speeds throughout a coastal region. Those atmospheric conditions are then used to predict how the ocean will respond by generating large waves and surge, and by flooding into low-lying areas.
Given all the variables involved, there’s a lot of room for error in storm wind and surge prediction modeling.
For our study, we wanted to know how forecasting errors affect subsequent coastal flooding predictions. To that end, we needed to answer a couple of questions: First, as a storm moves closer to the coast, how accurate are forecasts of certain storm parameters like track, size, and maximum wind speed? Second, how do those forecasts affect predictions of wind speeds and storm surge?
Proposal Defense: Rosemary Cyriac
How to Run Kalpana
Kalpana converts ADCIRC output files in netCDF format to Google Earth (kmz) or GIS shapefiles for use with conventional GIS software. The latest version of the code is maintained at our GitHub repository: https://github.com/ccht-ncsu/Kalpana.
Command line arguments control the way it produces output, including the number of contour levels, their values, and the color scale. When these specifications are absent from the command line, it uses reasonable default settings so in many cases only a few of the available command line options will be used for any particular plot.
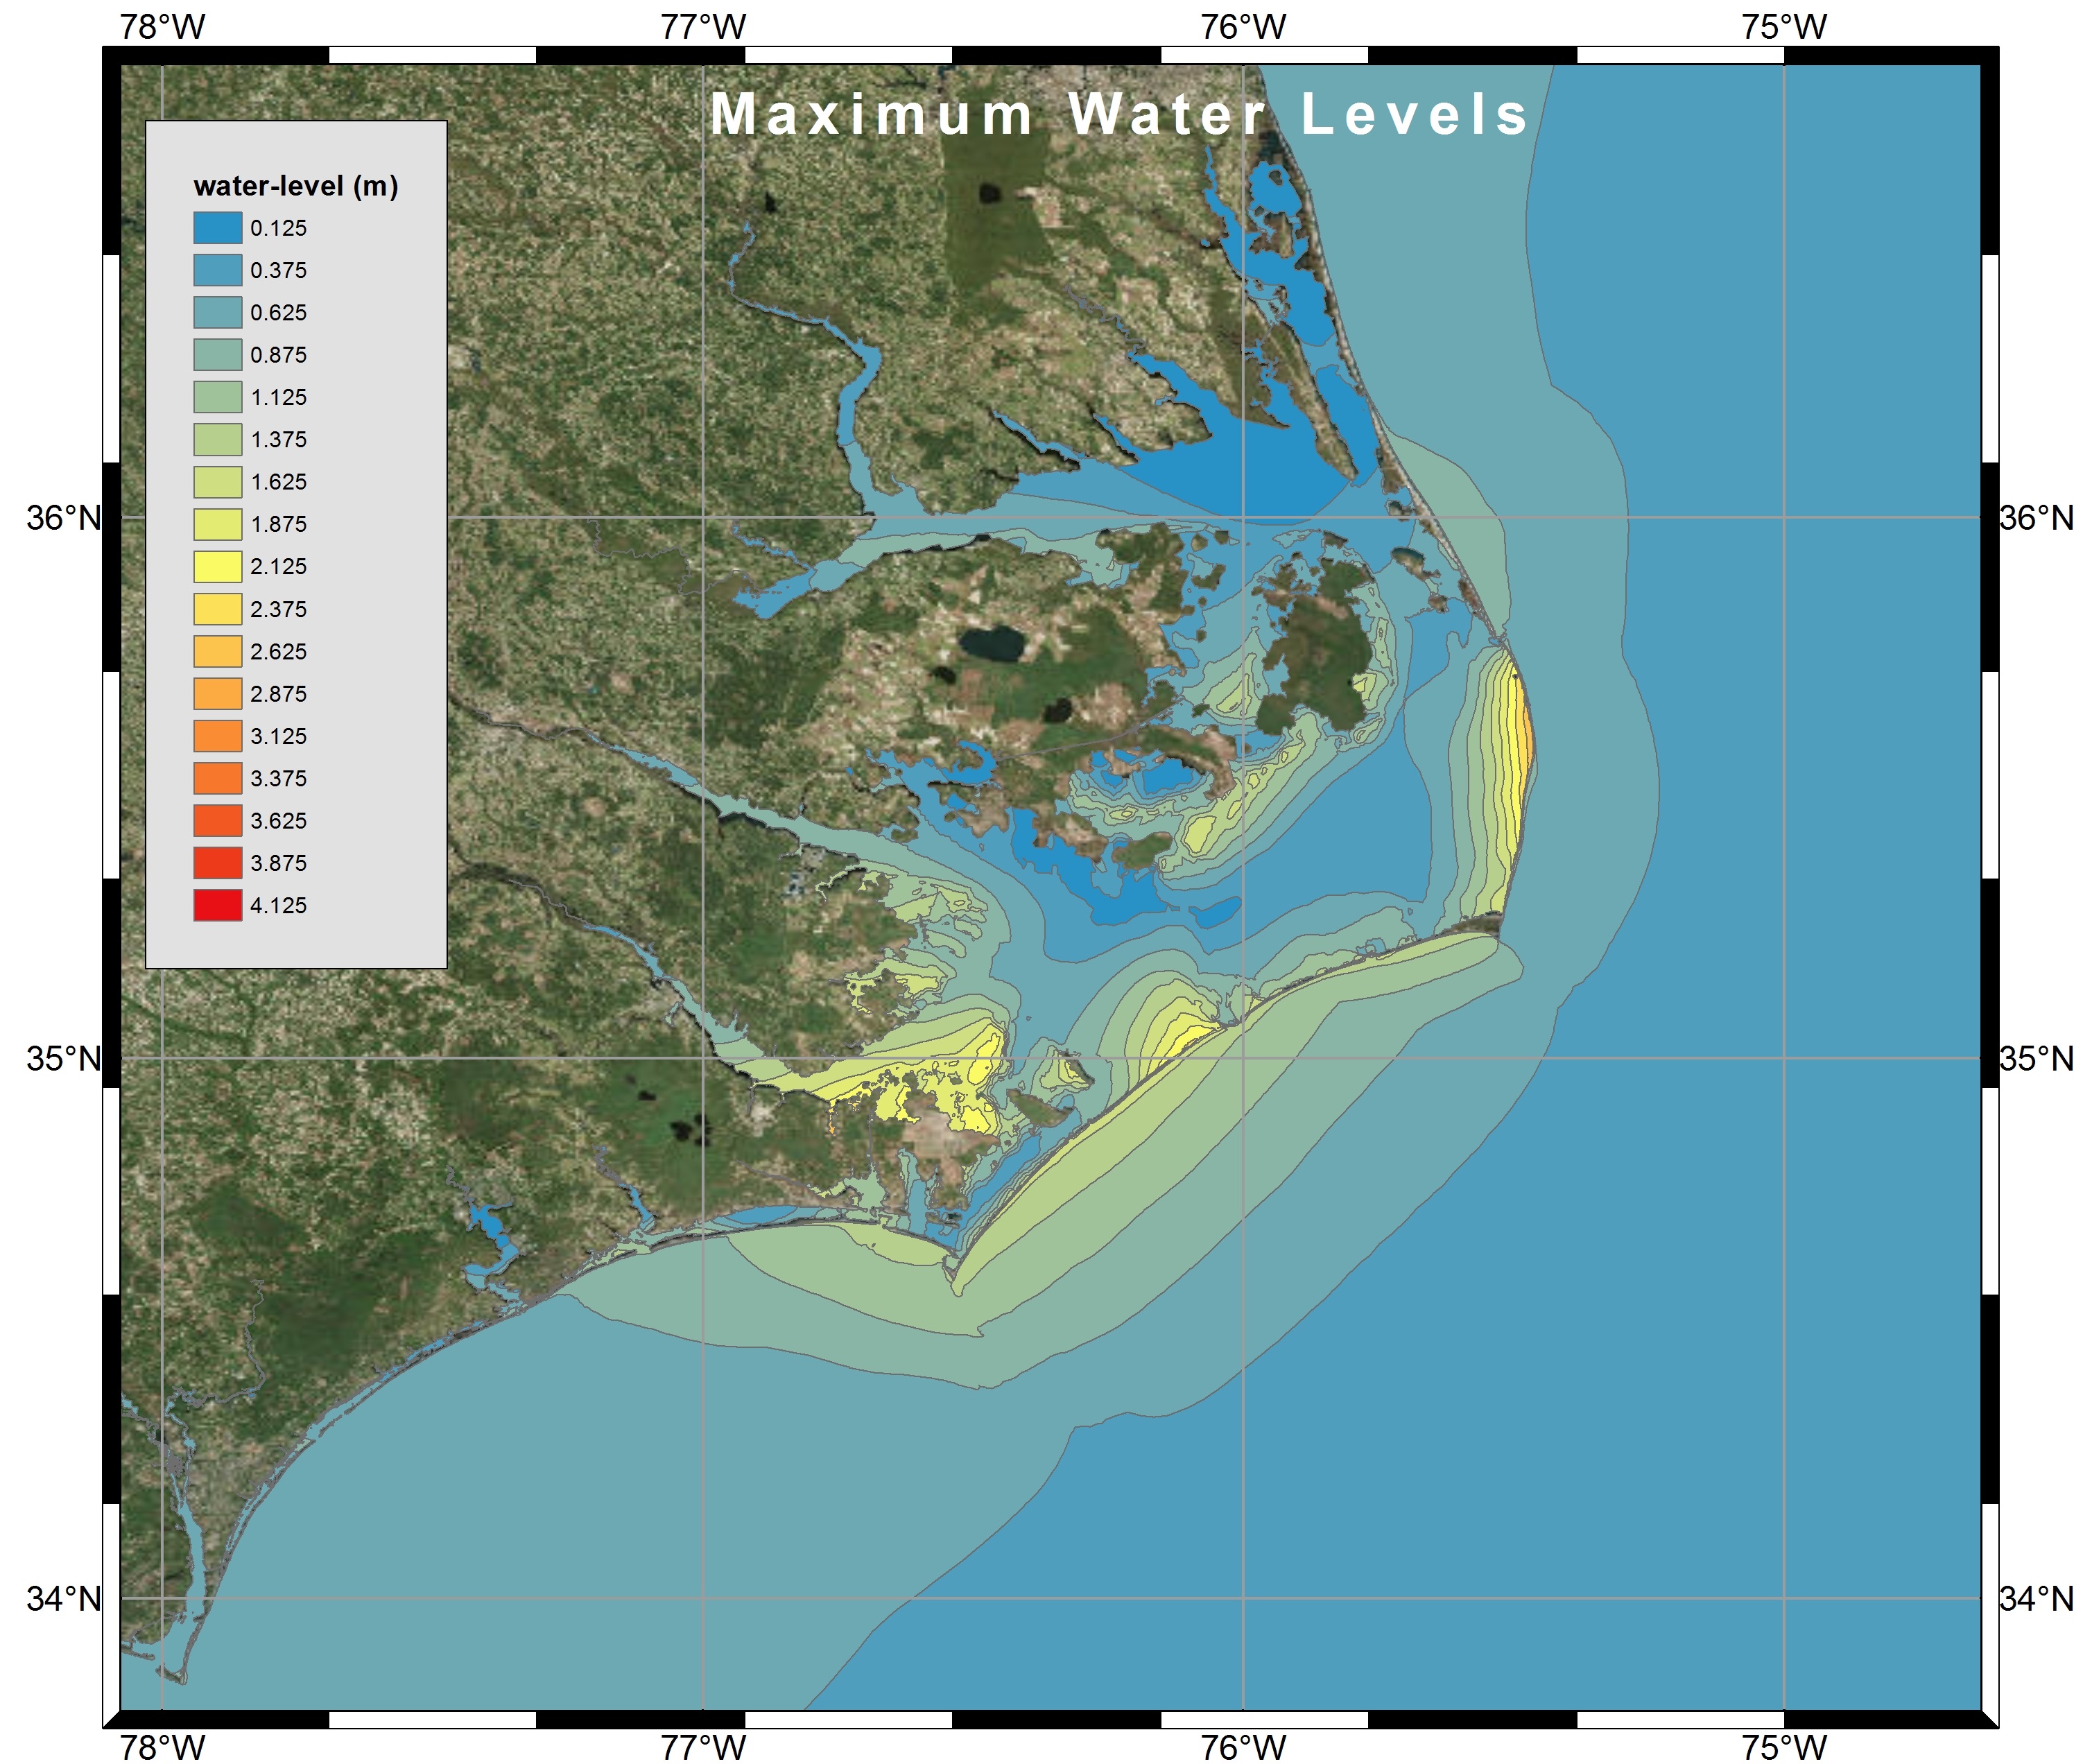
Visualization of Maximum Water Levels along the North Carolina coast during Hurricane Arthur (2014) using polygon shapefiles created by Kalpana with ArcGIS satellite imagery.
Recent Improvements to Kalpana
This post was contributed by CCHT collaborator Jason Fleming. He revised the Kalpana script to improve its efficiency and utility.
In the process of working on Kalpana, one of the deliverables was to clean the code, where possible. The following improvements were made as part of this deliverable.