
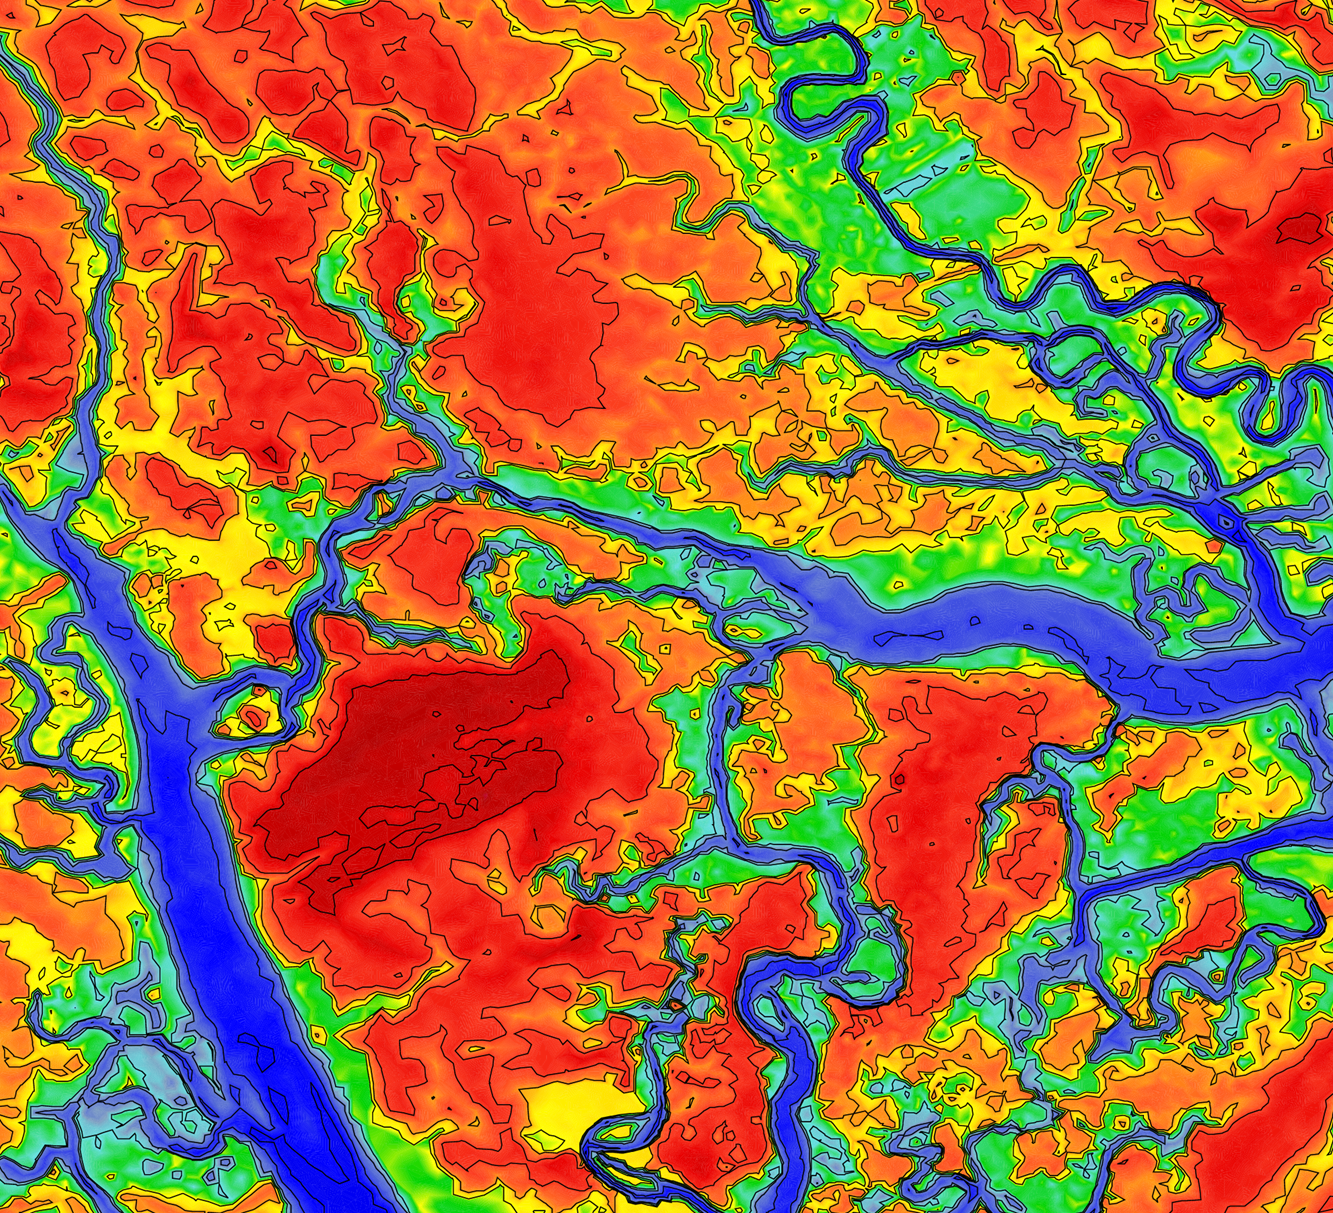
We should share more pretty images from our research, including this image of coastal floodplains and river channels. This is part of a larger mesh from Ajimon Thomas’s PhD work.

We should share more pretty images from our research, including this image of coastal floodplains and river channels. This is part of a larger mesh from Ajimon Thomas’s PhD work.
 Storm surge due to hurricanes and tropical storms can result in significant loss of life, property damage, and long-term damage to coastal ecosystems and landscapes. Computer modeling of storm surge is useful for two primary purposes: forecasting of storm impacts for response planning, particularly the evacuation of vulnerable coastal populations; and hindcasting of storms for determining risk, development of mitigation strategies, coastal restoration, and sustainability. Model results must be communicated quickly and effectively, to provide context about the magnitudes and locations of the maximum waves and surges in time for meaningful actions to be taken in the impact region before a storm strikes.
In this paper, we present an overview of the SWAN+ADCIRC modeling system for coastal waves and circulation. We also describe FigureGen, a graphics program adapted to visualize hurricane waves and storm surge as computed by these models. The system was applied recently to forecast Hurricane Isaac (2012) as it made landfall in southern Louisiana. Model results are shown to be an accurate warning of the impacts of waves and circulation along the northern Gulf coastline, especially when communicated to emergency managers as geo-referenced images.
-DSLOWREAD flag.
FigureGen is a Fortran program that creates images for ADCIRC files. It reads mesh files (fort.14, etc.), nodal attributes files (fort.13, etc.) and output files (fort.63, fort.64, maxele.63, etc.). It plots contours, contour lines, and vectors. Using FigureGen, you can go directly from the ADCIRC input and output files to a presentation-quality figure, for one or multiple time snaps.
This program started from a script written by Brian Blanton, and I converted it to Fortran because I am more familiar with that language. It now contains code written by John Atkinson, Zach Cobell, Howard Lander, Chris Szpilka, Matthieu Vitse, and others. But, at its core, FigureGen behaves like a script, and it uses system calls to tell other software how to generate the figure(s).
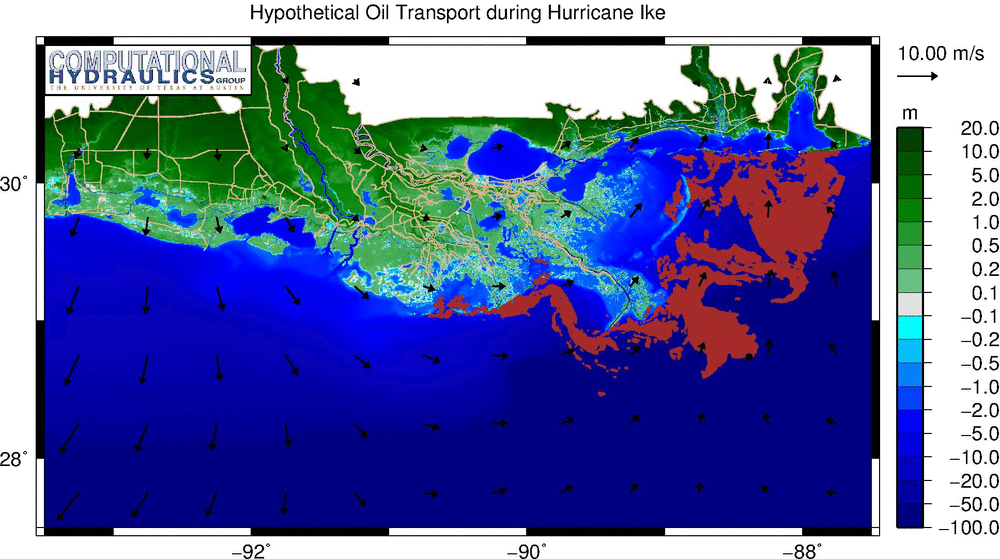
This example depicts hypothetical oil transport in the northern Gulf of Mexico. The oil spill is represented by Lagrangian particles and initialized with the observed conditions of 29 June 2010, but then the wind forcing of Hurricane Ike (2008) is applied. Oil is pushed into the marshes along the entire coastline of southern Louisiana.
FigureGen is a FORTRAN program that creates images for ADCIRC files. It reads output files (fort.63, fort.64, maxele.63, etc.), grid files (fort.14, etc.), nodal attributes files (fort.13), etc. It plots contours, contour lines, and vectors. Using FigureGen, you can go directly from the ADCIRC input and output files to a presentation-quality figure, for one or multiple time snaps, without having to use SMS.
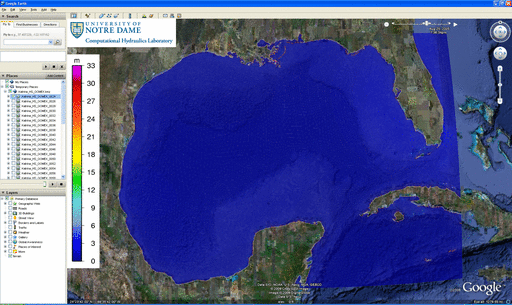
The following example depicts the water levels in ArcGIS as Ike moved through the Gulf:
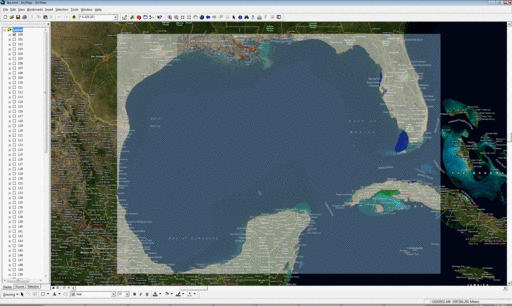
Contours of water levels (m) in the Gulf of Mexico during Ike (2008), as visualized in ArcGIS.
This program started from a script written by Brian Blanton, and it contains code written by John Atkinson, Howard Lander, Chris Szpilka, Zach Cobell, and others. I converted it to FORTRAN because I am more familiar with that language, and I added the capability to plot vectors, among other things. But, at its core, FigureGen behaves like a script, and it uses system calls to tell other software how to generate the figure(s).
FigureGen is a FORTRAN program that creates images for ADCIRC output files. It reads sparse (fort.63, fort.64, etc.) and full (maxele.63, maxwvel.63, etc.) output files, grid (fort.14, etc.) files, and nodal attributes (fort.13) files. It plots contours, contour lines, and vectors. Using FigureGen, you can go directly from the ADCIRC input and output files to a presentation-quality figure, for one or multiple time snaps, without having to use SMS.
The following example depicts the significant wave heights during Hurricane Katrina in the Gulf of Mexico:
Significant wave heights (m) during Katrina (2005) in the Gulf of Mexico.
This program started from a script written by Brian Blanton. I converted it to FORTRAN because I am more familiar with that language, and I added the capability to plot vectors, among other things. But, at its core, FigureGen behaves like a script, and it uses system calls to tell other software how to generate the figure(s).
Updated 2012/06/05: This version of FigureGen has become outdated, but is maintained on this page for reference. Please click here to be redirected to the newest version.
FigureGen is a FORTRAN program that creates images for ADCIRC output files. It reads sparse (fort.63, fort.64, etc.) and full (maxele.63, maxwvel.63, etc.) output files, grid (fort.14, etc.) files, and nodal attributes (fort.13) files. It plots contours, contour lines, and vectors. Using FigureGen, you can go directly from the ADCIRC input and output files to a presentation-quality figure, for one or multiple time snaps, without having to use SMS.
The following example depicts the wind reduction factors for our hurricane runs in southeast Louisiana:
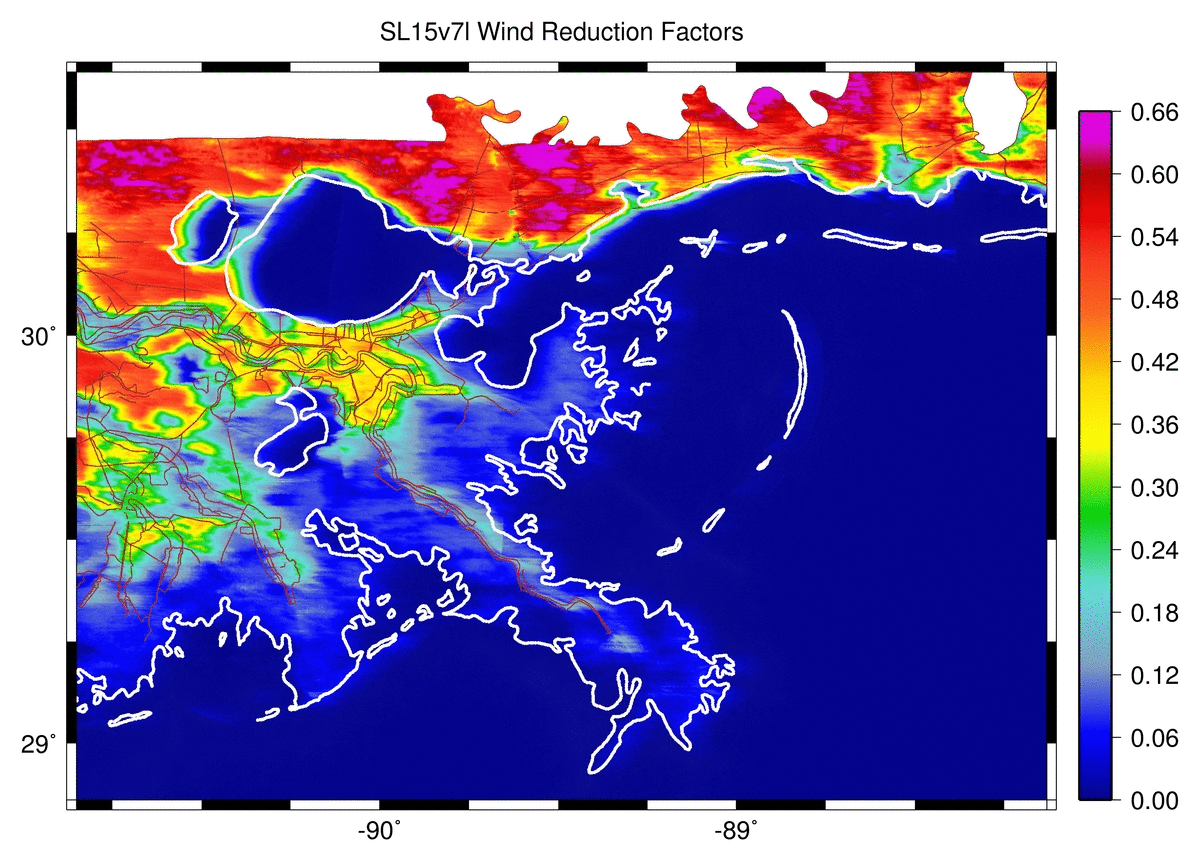
Directional wind reduction factors in the northern Gulf of Mexico.
This program started from a script written by Brian Blanton. I converted it to FORTRAN because I am more familiar with that language, and I added the capability to plot vectors, among other things. But, at its core, FigureGen behaves like a script, and it uses system calls to tell other software how to generate the figure(s).