

Oceans and coastal regions play a critical role in the world’s economic and social activity, but we are still learning how to live and interact sustainably with these complicated systems. Natural disasters like hurricanes devastate a region within a few hours or days, whereas slower processes like sediment deposition transform a region over many years. Small changes have unintended effects over localized regions, and, taken together, affect entire basins.
Computational modeling is a crucial tool in the effort to understand these processes. We develop models to describe the oceans in deep water and the nearshore, and then validate them against the best available measurements and knowledge of natural behavior. The successful application of these large-scale models leads to better representations of coastal processes, and thus to improved understanding of the natural and built environments.
Contours of water levels (m) and vectors of wind velocities (m/s) during Hurricane Arthur (2013) in coastal North Carolina.
It is an exciting time to be a computational modeler. High-performance computing continues to advance with the introduction of faster processors, massively parallel systems, more memory, and better coding tools. We are increasing the model resolution to simulate at a larger range of scales, incorporating more complex physics to describe the coastal behavior, and providing faster forecasts of extreme events.
There are so many questions that we must answer in order to live sustainably along our coasts. Is erosion a local process, or is it influenced by processes on larger scales? How much does sediment transport affect the evolution of waves and surge during extreme events? Can we provide forecasts of storm surge that are accurate to street- or house-scales? Can we say anything useful about contaminant transport on shelf- or basin-scales, and can we do it in real time? These are just a few of the questions that we consider.
The goal will always be to build models that simulate coastal ocean behavior in ways that are more accurate, efficient and robust than ever before, and then to apply those models to evaluate and improve the design and resiliency of our coastal infrastructure.
Focus Areas
We are working on projects with three focus areas: (1) extending model capabilities, through the incorporation of additional physical processes, such as density-driven flows in estuaries and dune erosion on barrier islands; (2) improving model efficiency, through the use of modern techniques for parallel computing, so the resources are used optimally; and (3) communicating model results, through the integration of novel visualization techniques with the needs of end users.
Extending Model Capabilities
-
GoMRI CARTHE 2015-2017 — With collaborators at UT-Austin, we are working as part of the Consortium for Advanced Research on Transport of Hydrocarbon in the Environment (CARTHE) to understand how pollutants and other materials are transported on ocean currents. This project is a continuation of our work after the oil spill caused by the failure of the Deepwater Horizon drilling platform, and it is focused on understanding how waves and currents affect transport in coastal regions. Rosemary Cyriac is building a model of the Choctawhatchee Bay and River system, including freshwater riverine flows through to the marine environment on the continental shelf. We are trying to reproduce some of the observations from the Surfzone Coastal Ocean Pathways Experiment (SCOPE), especially how the bay outflows can affect transport.
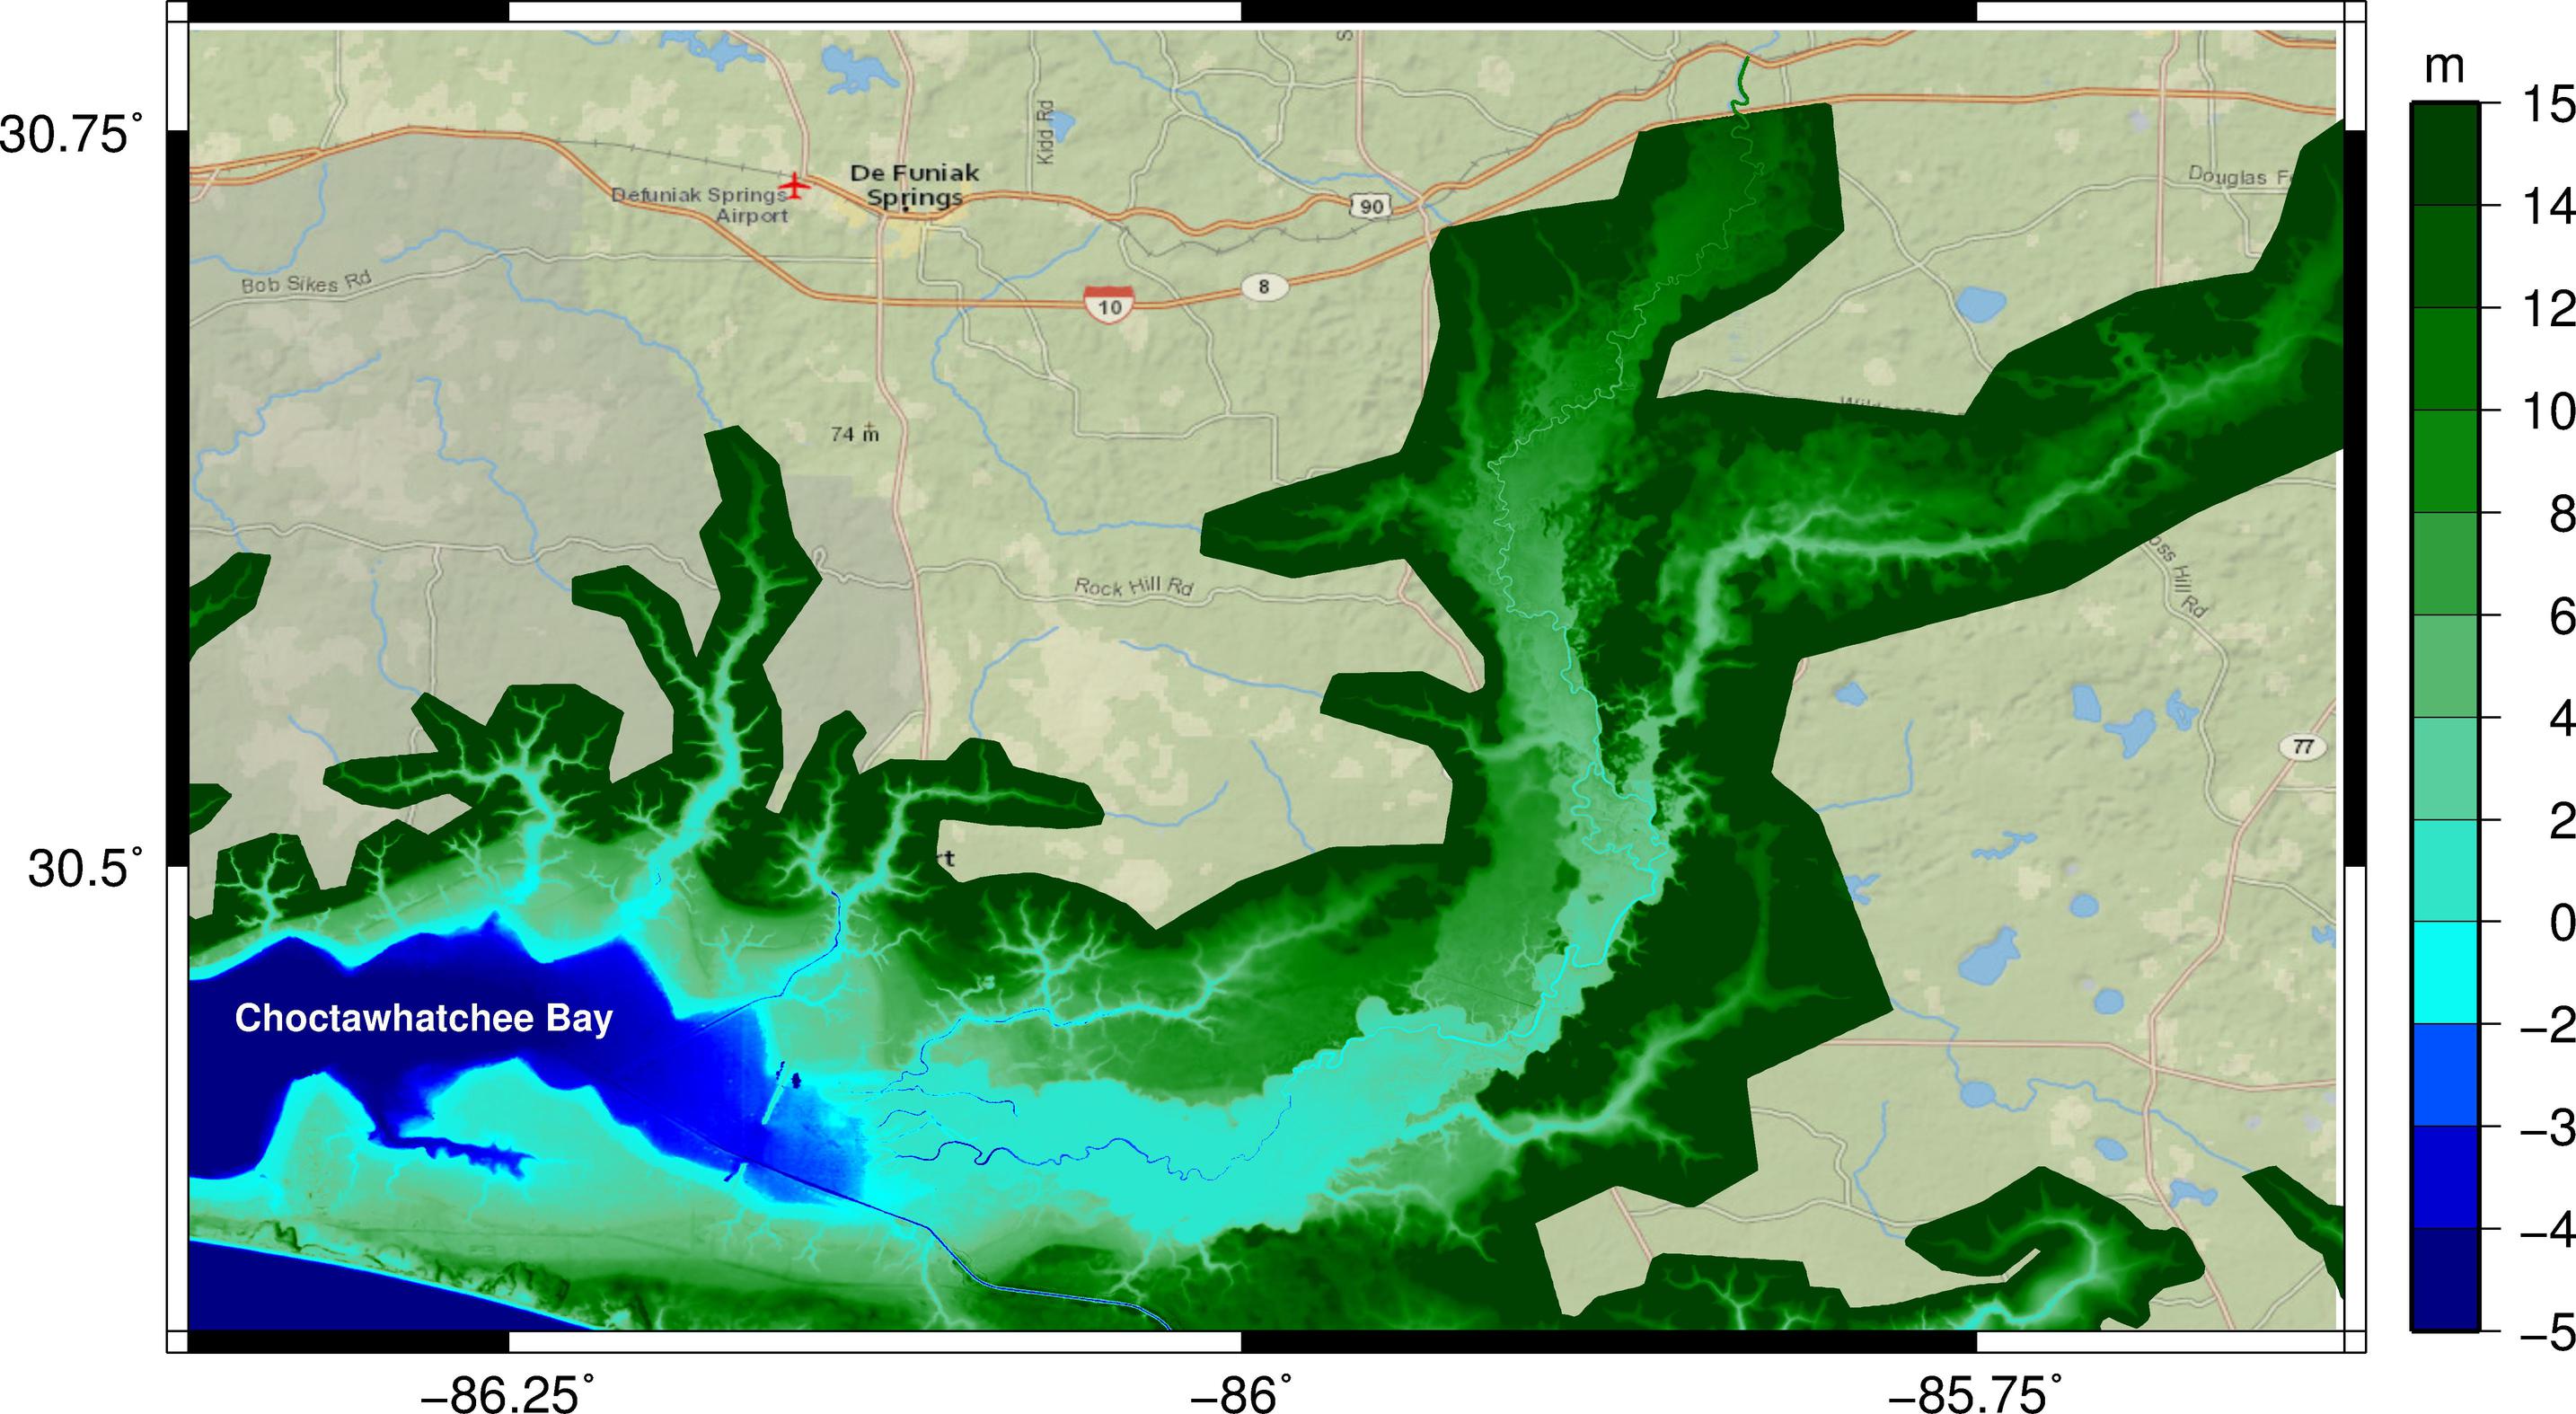
Editing to increase mesh resolution in the Choctawhatchee River system.
-
NC Sea Grant 2016-2018 — We are working with collaborators at NCSU and UNC to couple the SWAN+ADCIRC modeling system with the XBeach model for morphodynamics during extreme events. This project is novel in that we are implementing a two-way coupling, i.e., topographic changes due to dune erosion and barrier island breaching will be mapped back to the wave and surge models. Alireza Gharagozlou is gaining experience with XBeach and developing models for Hatteras Island during Hurricane Isabel (2003). We are hoping to simulate the morphodynamics over the majority of the island, and then pass them back to SWAN+ADCIRC to improve predictions of storm-induced flooding.

Hurricane Irene (2011) caused sound-side flooding of the Outer Banks, erosion and breaching along Pea Island, and damage to NC 12 that limited access between Hatteras Island and the mainland. This image shows the island topography before the storm.
Improving Model Efficiency
-
DHS CRCoE 2016-2017 — With collaborators at UT-Austin, we are working as part of the DHS Coastal Resilience Center of Excellence (CRCoE) to speed up the ADCIRC model for storm surge and coastal flooding. By improving its parallelization, we will require the model to better utilize the available computing resources, and provide resolution only in regions where flooding is expected to occur. The resulting model will allow for faster forecasts during a storm, and more simulations in design scenarios between storms.
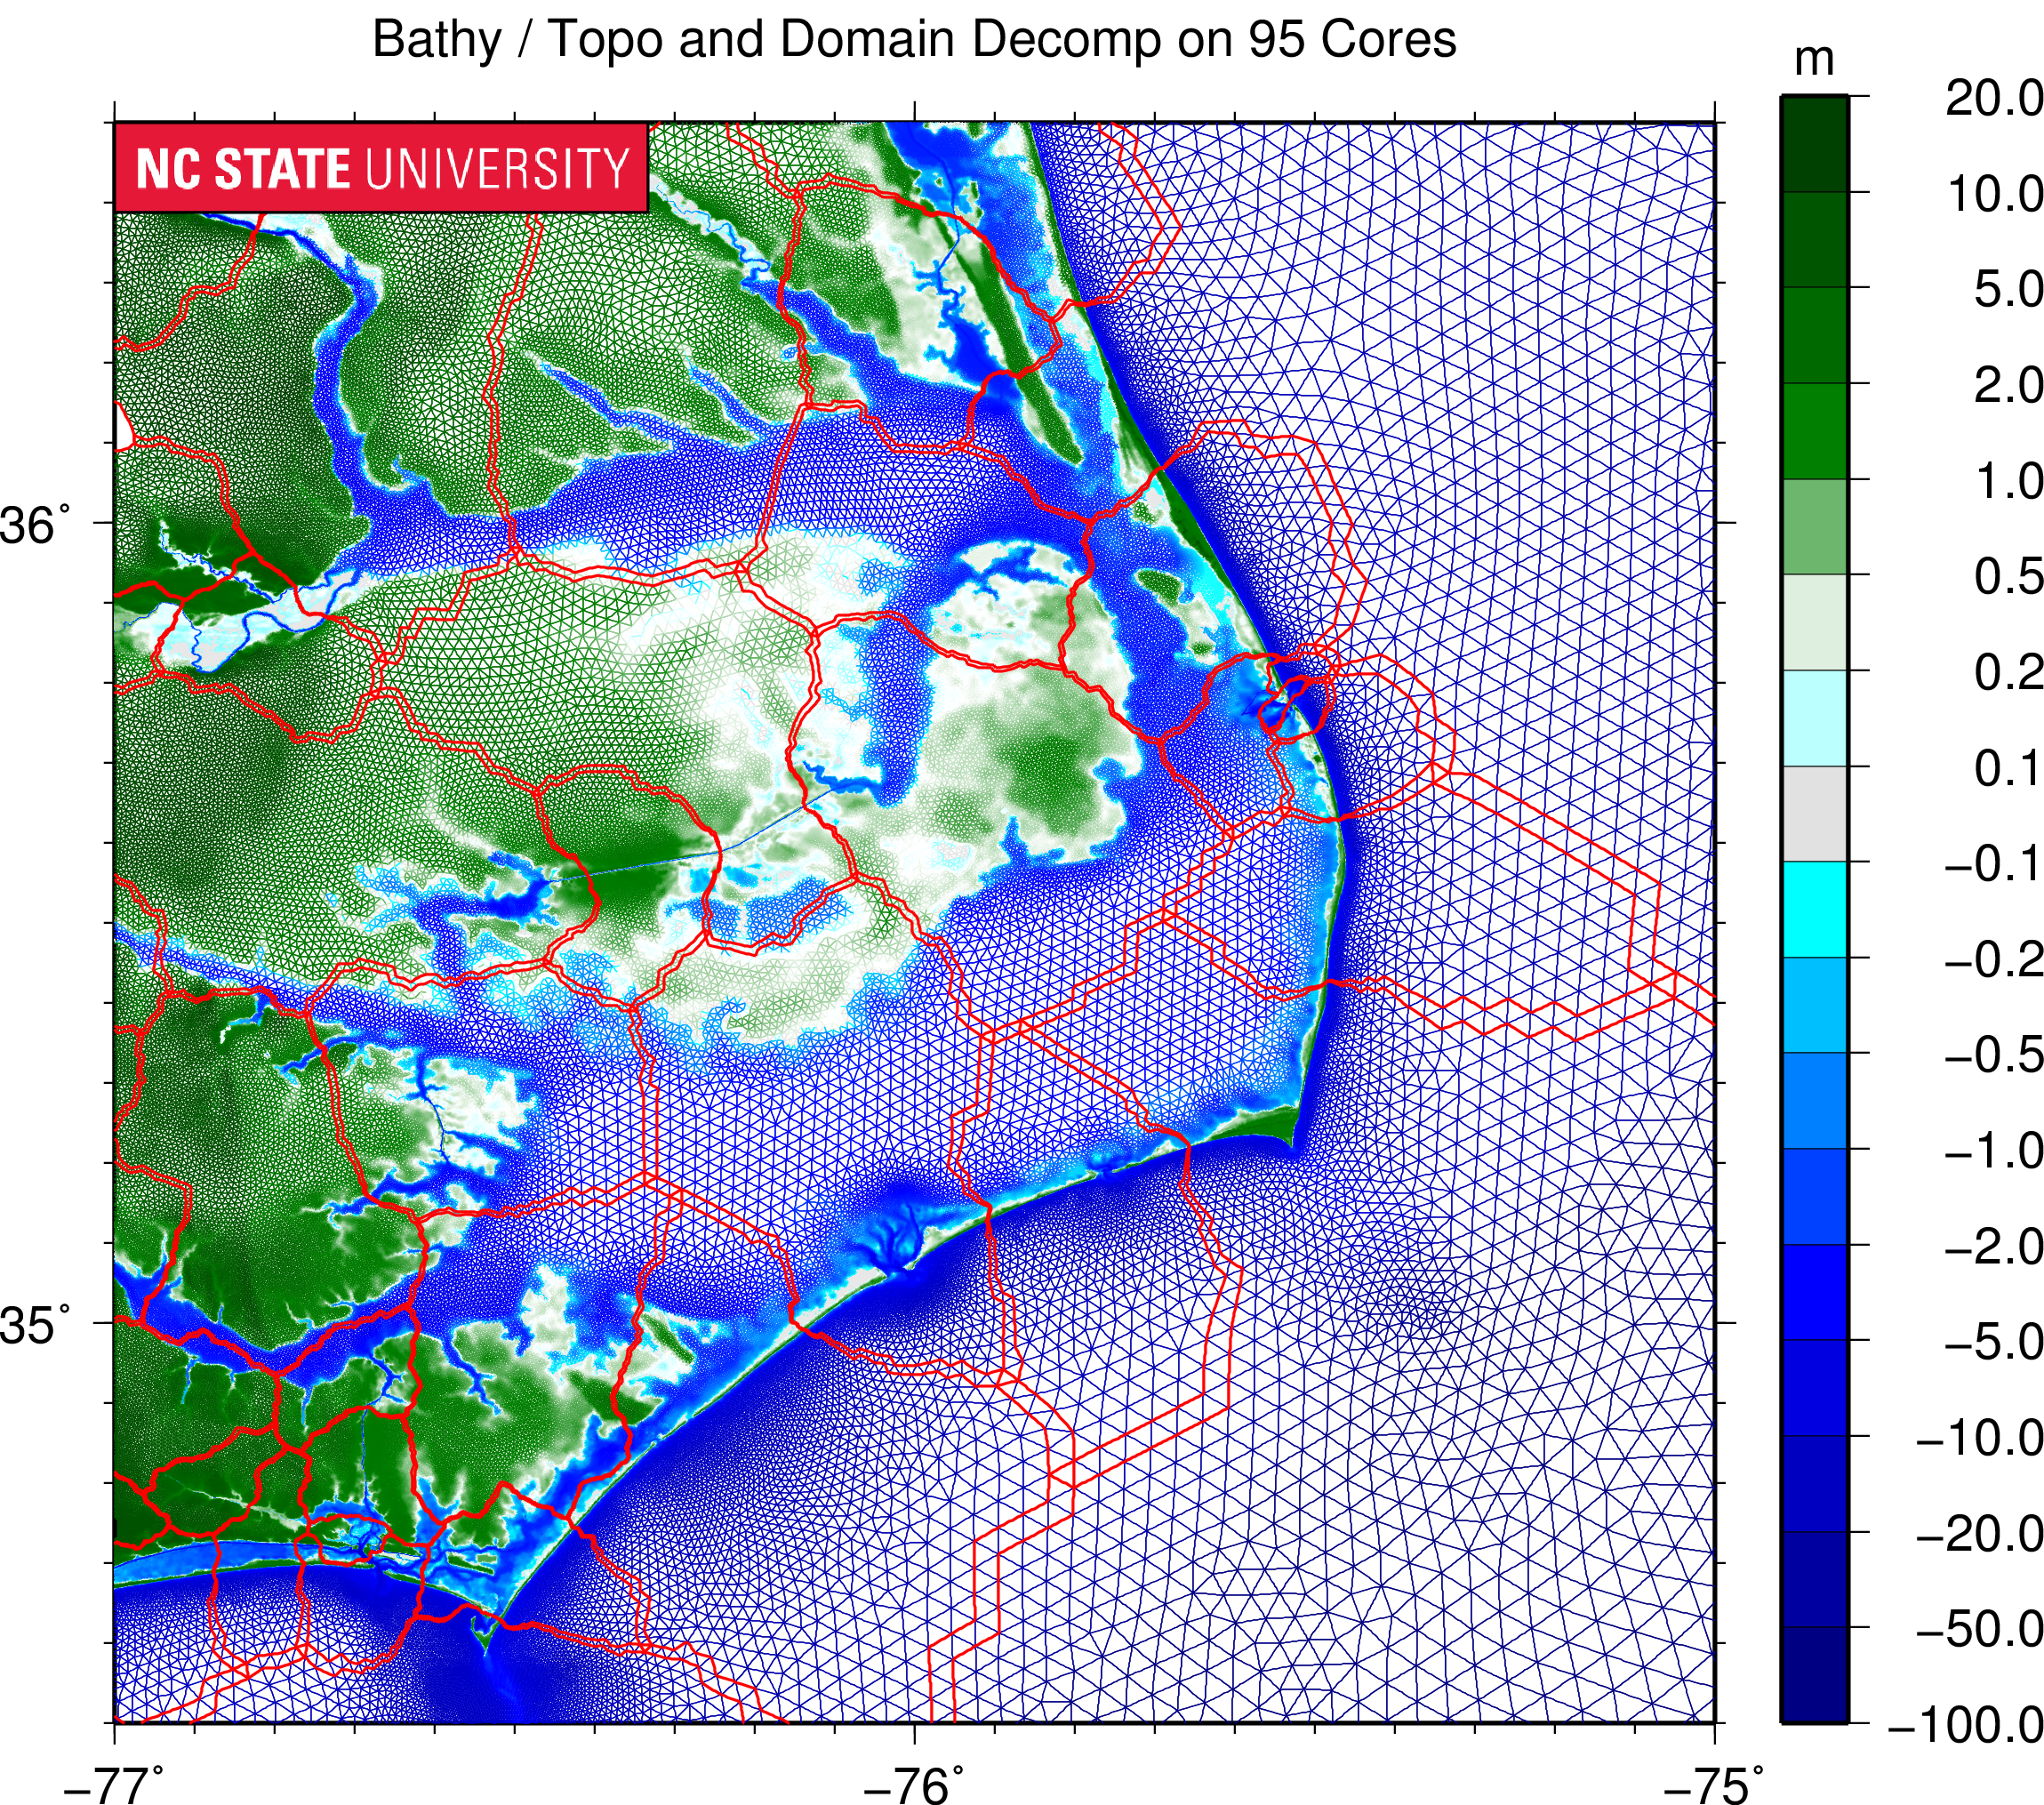
Example of ADCIRC domain decomposition for the NC9 mesh describing the North Carolina coastal region.
-
NC Sea Grant 2014-2016 — With collaborators at UNC, RENCI, and Seahorse Coastal Consulting, we are developing techniques to optimize the placement of resolution in unstructured meshes used by ADCIRC. Ajimon Thomas is computing accuracy errors and mass residuals during high-resolution simulations of storm surge in North Carolina, and then exploring how these error metrics can be used to identify regions where mesh resolution can be refined or coarsened.
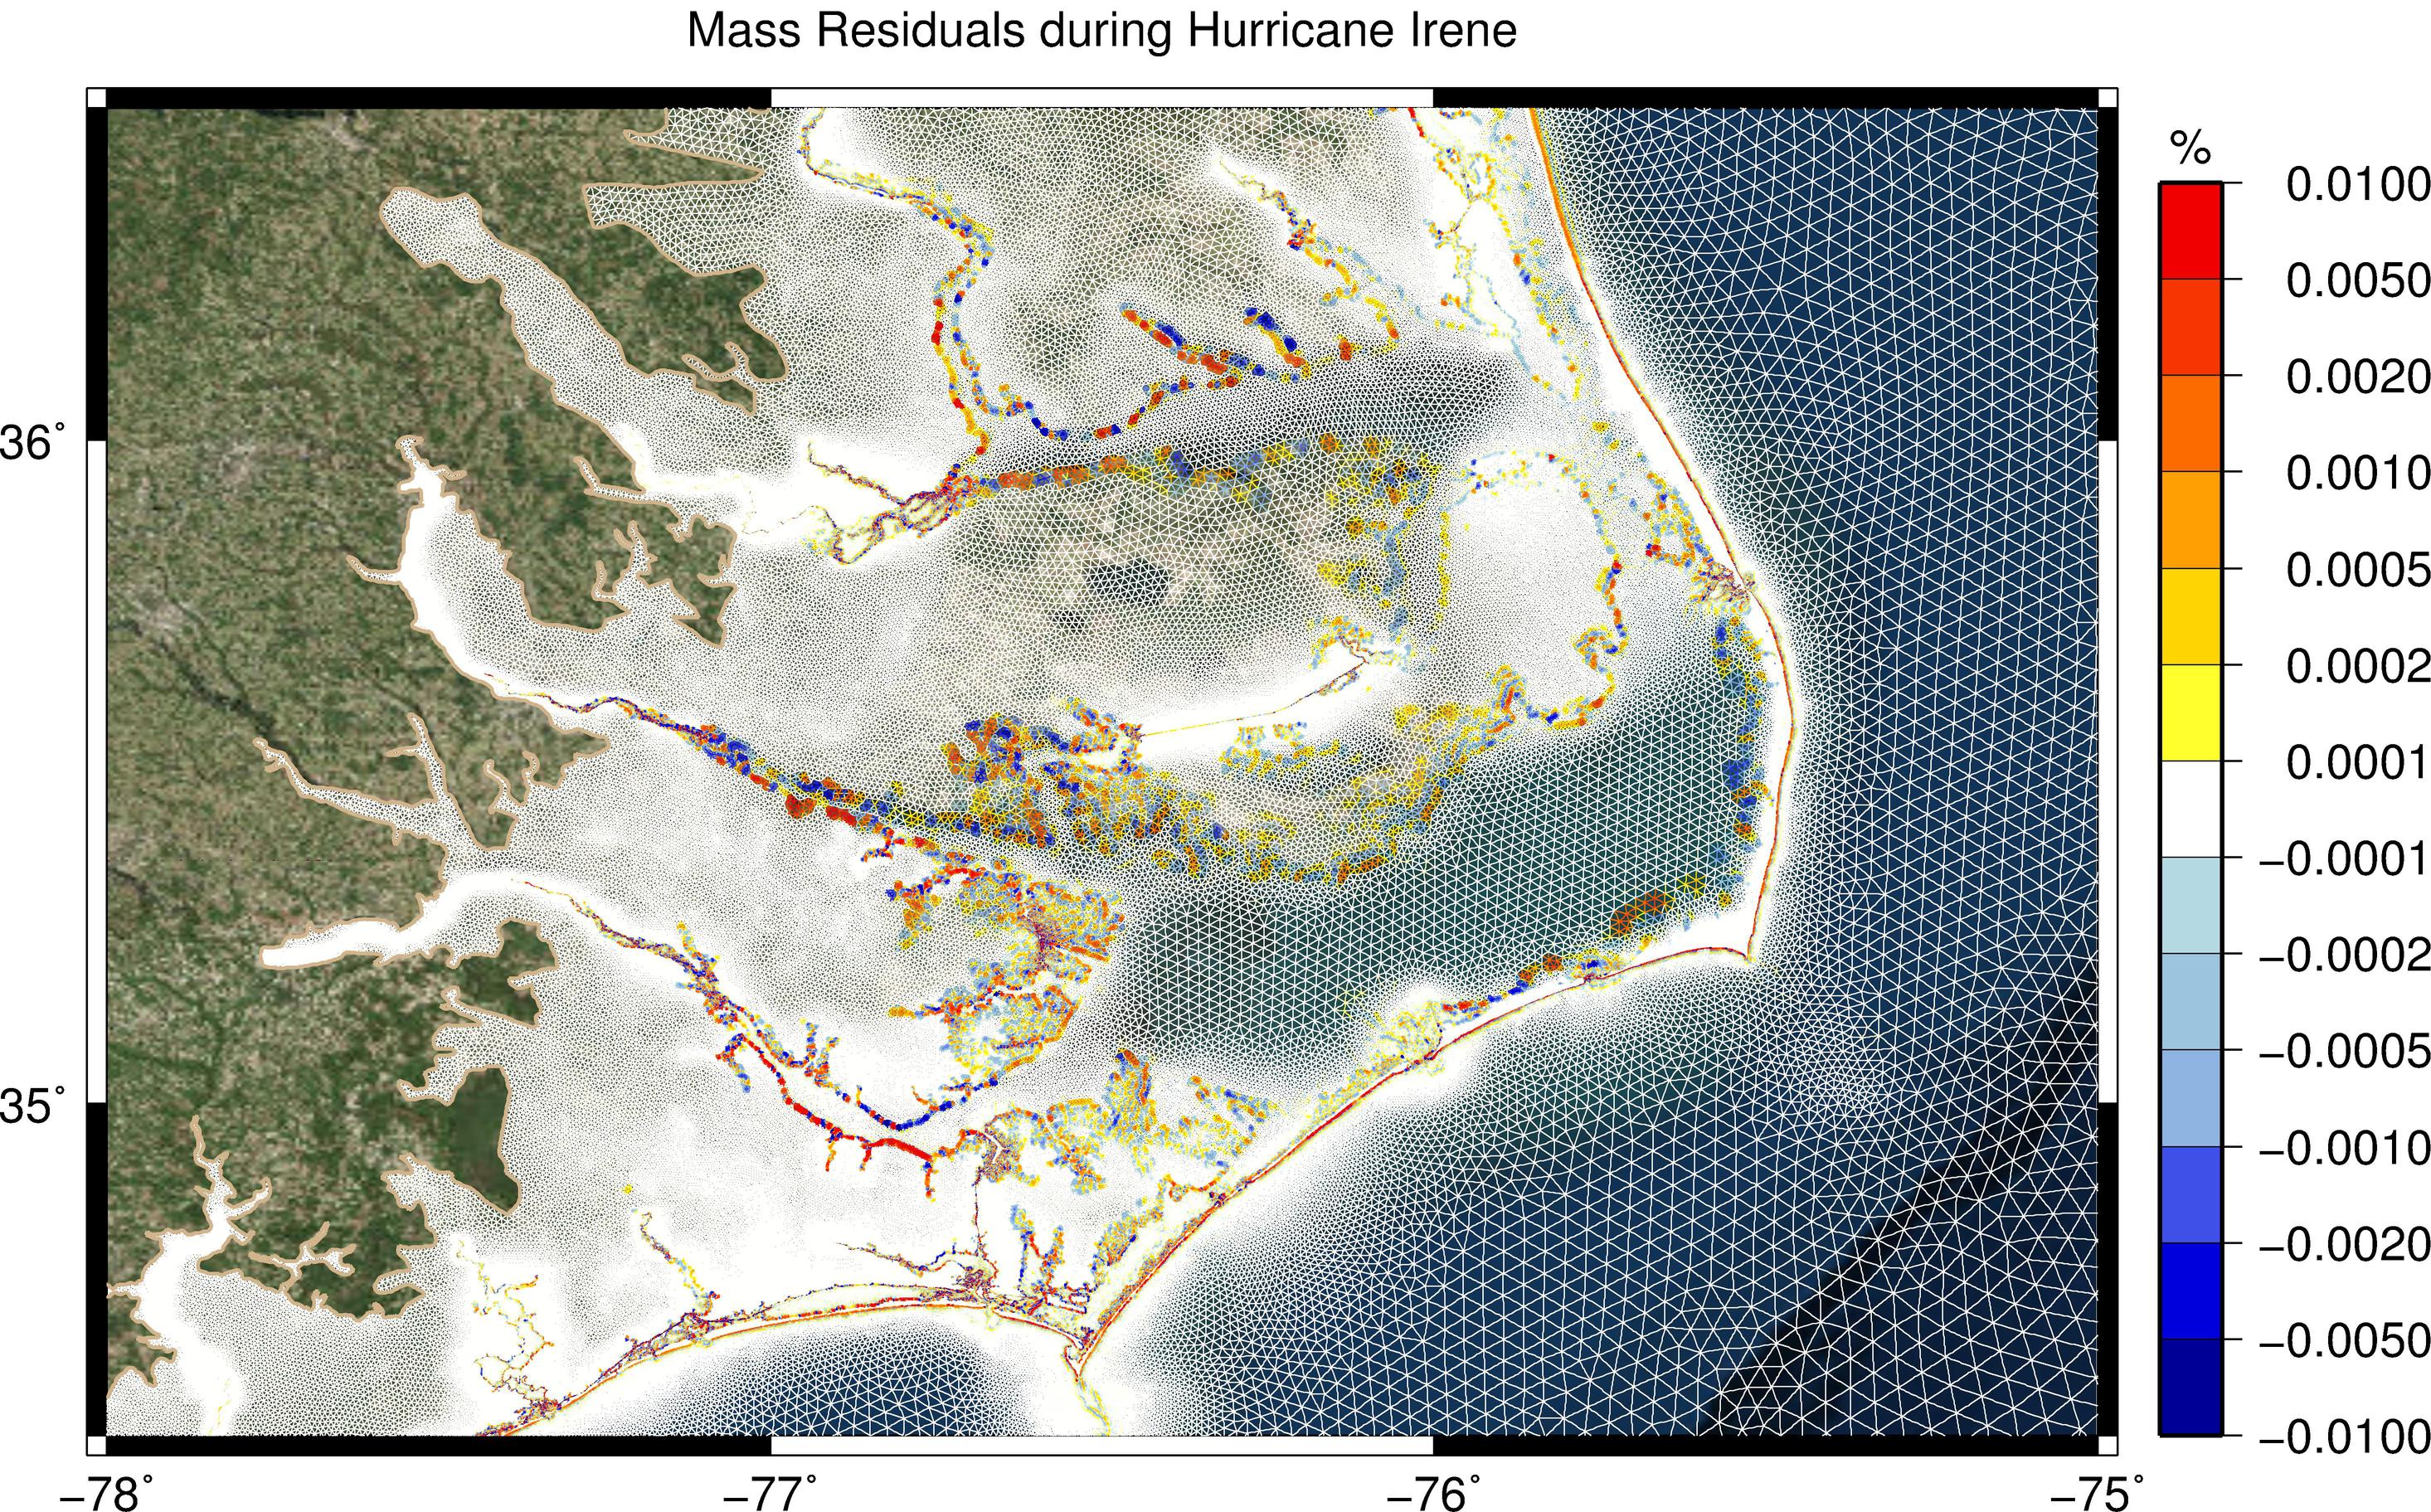
Mass residuals (as percentage of still-water volume) during Hurricane Irene (2011).
Communicating Model Results
-
NC Sea Grant 2014-2016 — With collaborators at UNC, RENCI, and Seahorse Coastal Consulting, we developed a visualization tool called Kalpana, which can display SWAN+ADCIRC data in GIS and Google Earth formats. Kalpana is written in Python and utilizes a set of existing libraries for file input and visualization, and it writes graphics in vector format to maintain the model resolution. These GIS and Google Earth files can then be combined with geospatial data in other formats for use by end users. Kalpana has been integrated within the forecasting system for North Carolina, and these geospatial visualization files are generated during every advisory cycle.
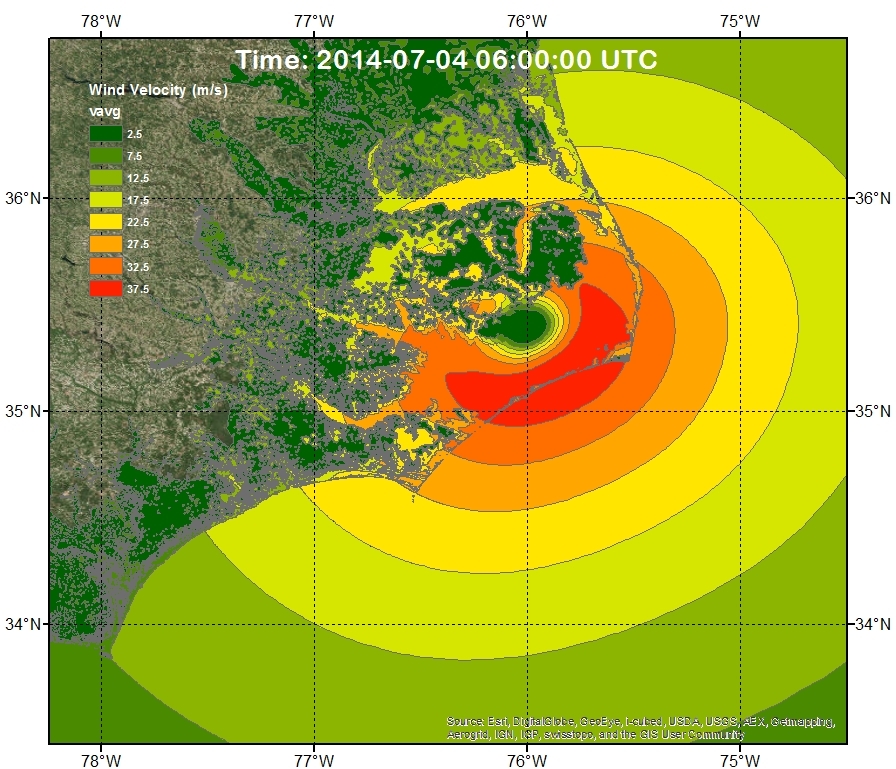
Example of GIS visualization of ADCIRC model output, specifically wind speeds (m/s) at 0600 UTC 04 July 2014 during Hurricane Arthur (2014).
-
NCDS Data Fellows 2016-2017 — We are extending the capabilities of Kalpana to enable data-driven decision-making for coastal communities during storm events. Nelson Tull is connecting ADCIRC forecast data to geospatial databases for use by emergency managers to consider inundation and damages during storm scenarios. The critical objectives of this proposed research are (1) downscaling the model forecast data to the resolution of geospatial datasets used for decision support, (2) assessing the implications of this downscaling on forecast accuracy, and (3) connecting these technologies with an end user, specifically the NC Emergency Management.
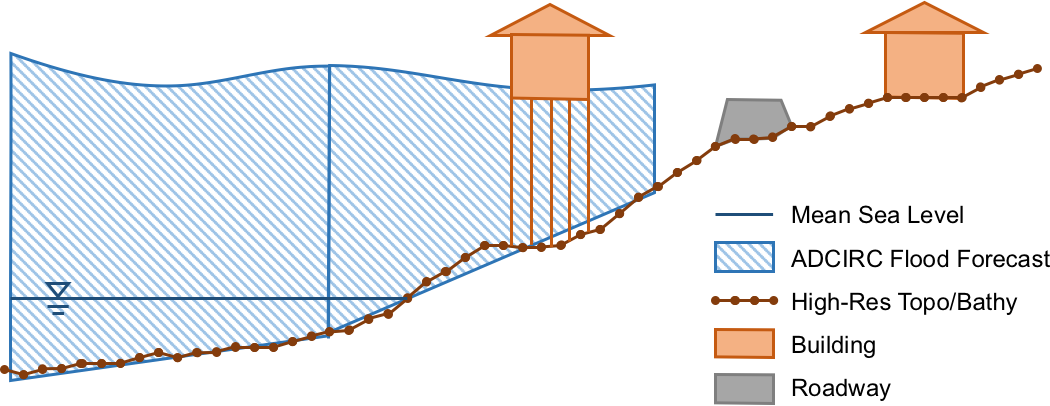
The flooding forecast is limited by the resolution used by ADCIRC, and it must be mapped to the resolution of the geospatial data for use in impact assessment. Mapping will depend on local hydraulic conditions.