

This document describes the methodology followed in kalpana.py for the creation of shape file and kml files. The sequence of steps involved has been grouped under related sub-headings for better comprehension. The terms in fixed width font refer to variable names in the code.
Category Archives: NC Sea Grant 2014-2016
Installing Python Modules for Kalpana
This post was contributed by CCHT collaborator Jason Fleming. This is a LONG post, but as he notes, it is a stream of consciousness about how he compiled the modules needed by Kalpana. Hopefully his experience will be helpful to new users. After the modules have been compiled, then Kalpana is very easy to use. So please don’t be discouraged!
The actual script kalapana.py does not require installation, it is merely executed. However, it relies on several Python modules that most users (or their IT supporters) will need to install before working with Kalpana. These modules are:
matplotlib– main python module used for data visualization.pylab– Imports plotting and numerics libraries in a single name space.shapely– used to construct geometric objects like Points, Polygons and LineStrings.fiona– for writing .shp files.netCDF4– reading and writing netCDF files.datetime– dates and time calculation, manipulation, and formatting.time– contains time related functions for measuring the performance of the code itself.numpy– to facilitate scientific computing; used primarily in Kalpana for working with n-dimensionalnumpyarrays, which are ideal for storing large amounts of data.collections– accessing OrderedDict, which is a dictionary subclass that remembers the order in which entries were added, whereas an ordinary dictionary does not do so).simplekml– writing kml (Google Earth) files.
In the process of installing Python modules on a desktop platform, as well as an HPC platform, I’ve found that the process can be very challenging. The biggest issue is conflicting module version dependencies, which can be handled by the use of virtual execution environments for Python (explained below).
Conference: ADCIRC 2016
Poster: NCSU Symposiums 2016
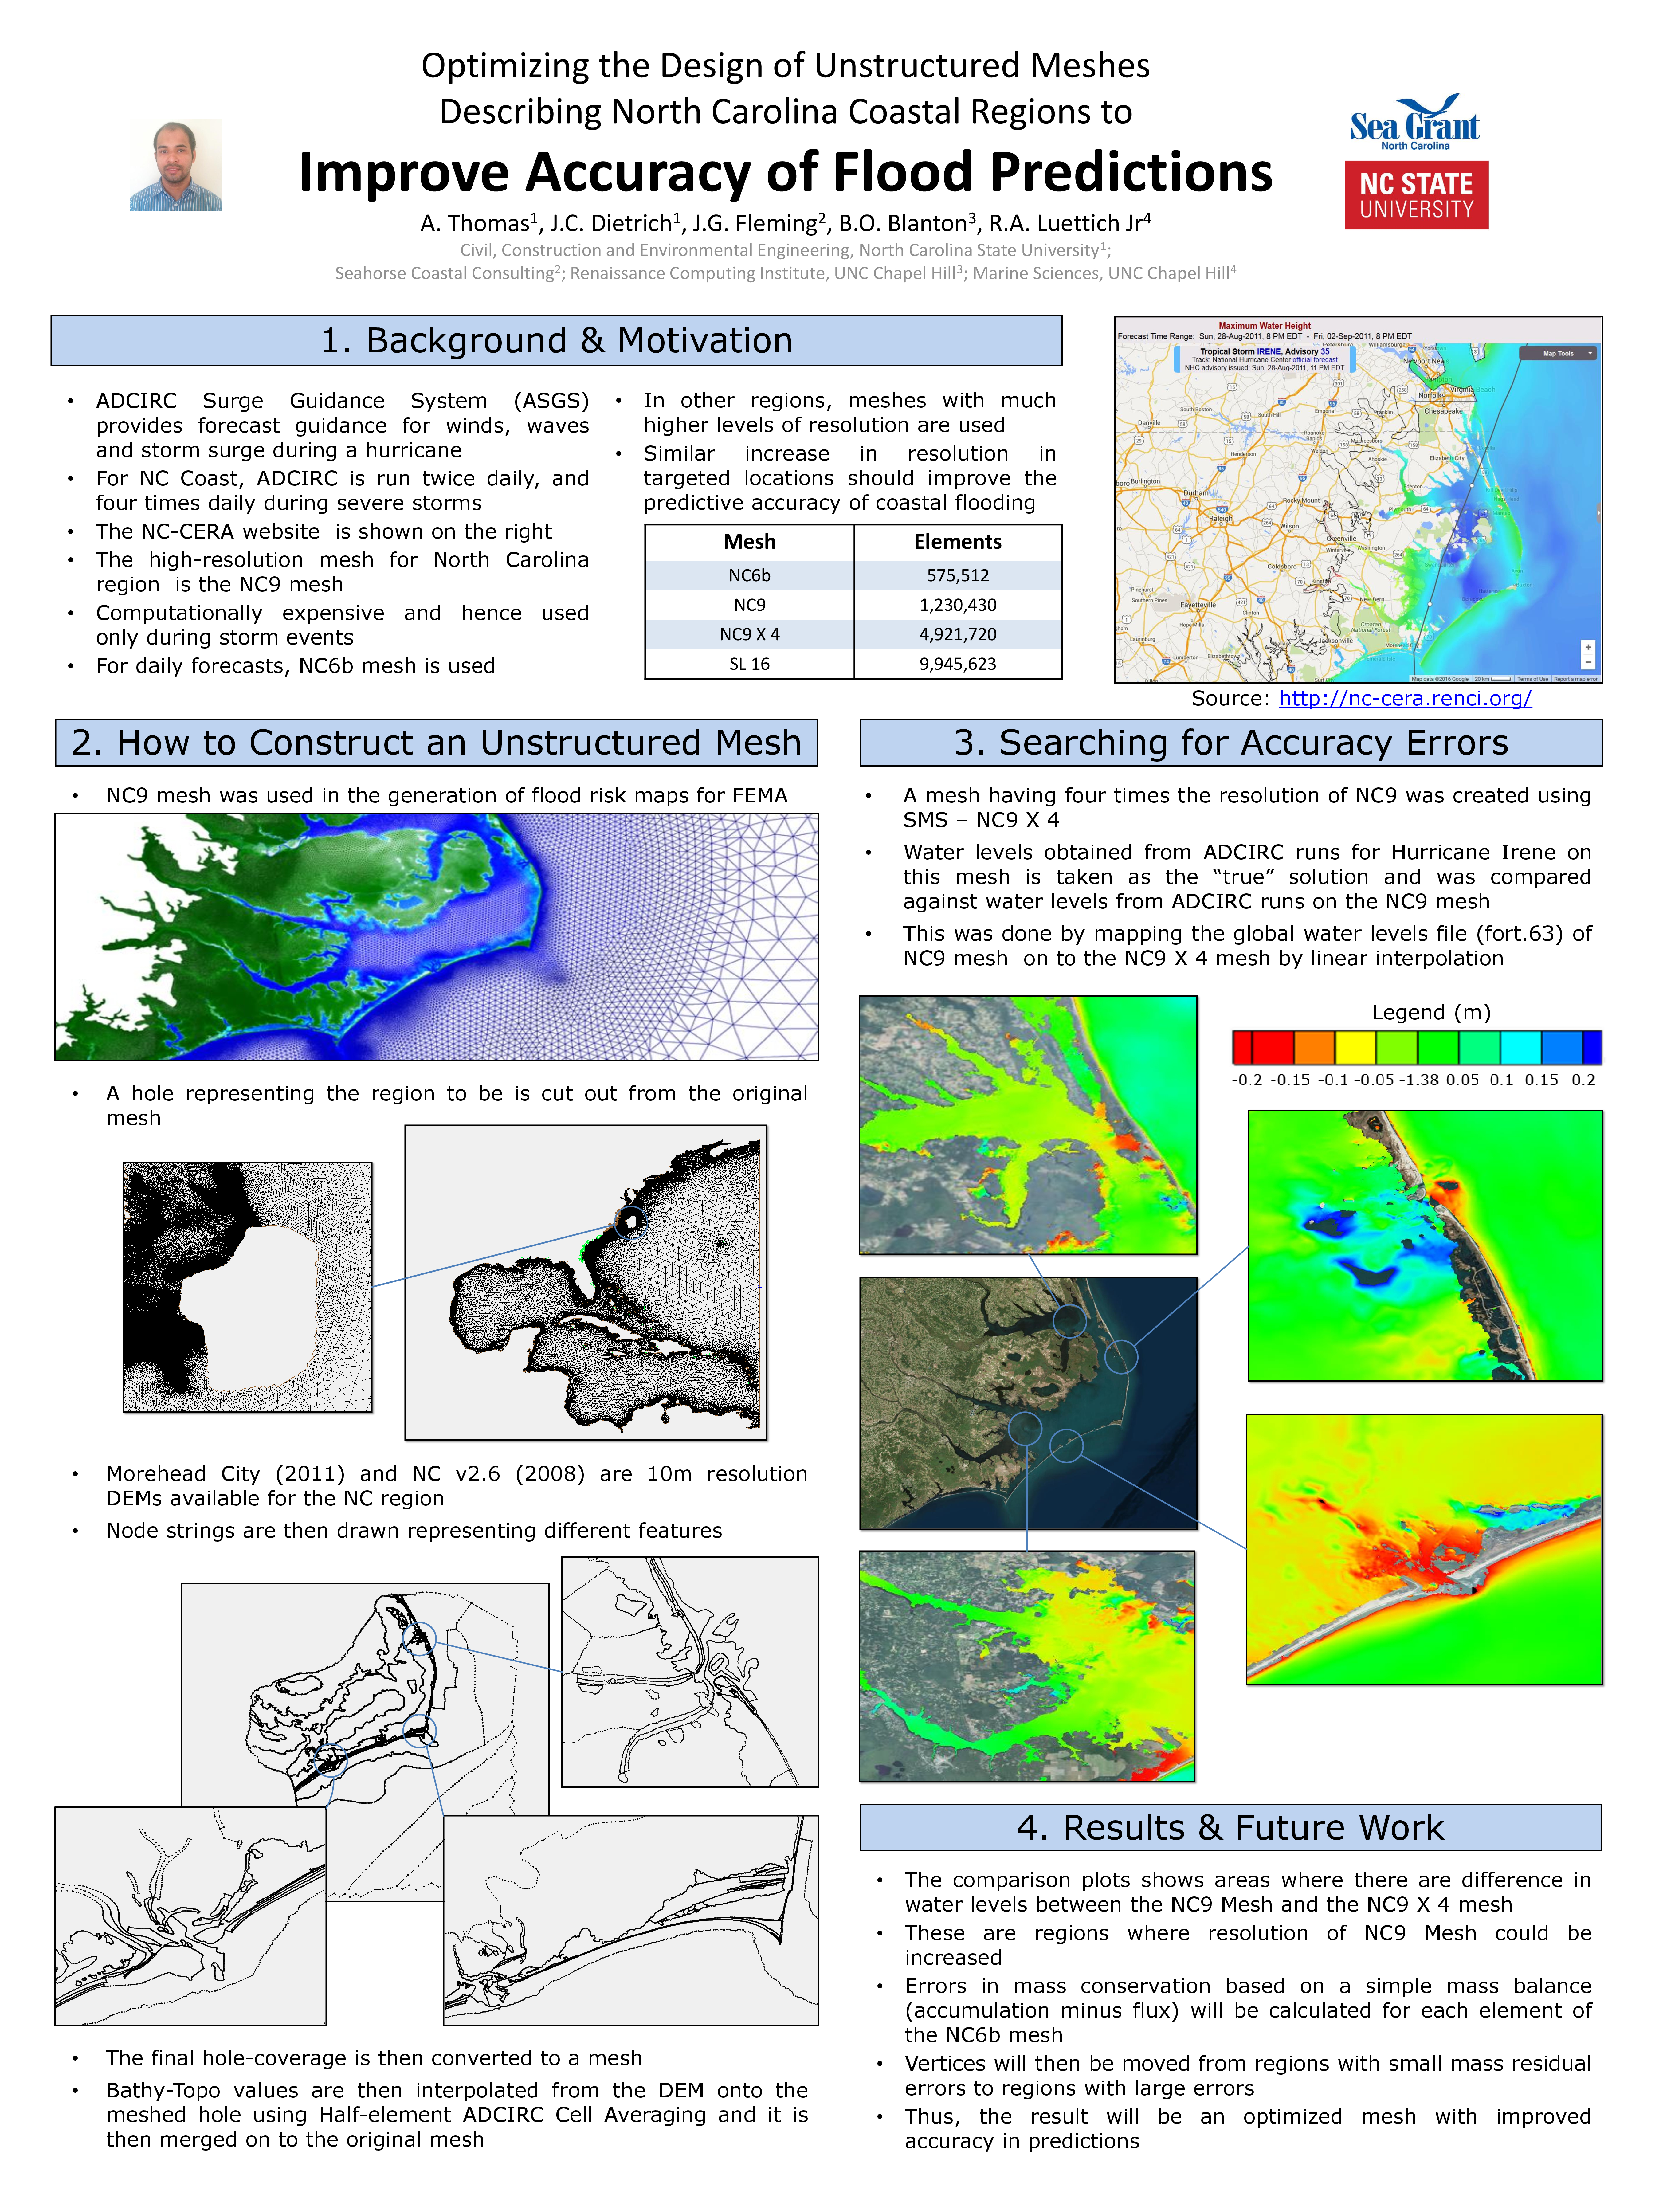
A Thomas, JC Dietrich, JG Fleming, BO Blanton, RA Luettich Jr. “Optimizing the Design of Unstructured Meshes Describing North Carolina Coastal Regions to Improve Accuracy of Flood Predictions.” Environmental, Water Resources and Coastal Engineering Research Symposium, North Carolina State University, 04 March 2016.
A Thomas, JC Dietrich, JG Fleming, BO Blanton, RA Luettich Jr. “Optimizing the Design of Unstructured Meshes Describing North Carolina Coastal Regions to Improve Accuracy of Flood Predictions.” Computing & Systems Research Symposium, North Carolina State University, 22 April 2016.
Conference: YCSEC-NA 2015
Conference: ADCIRC 2015
Conference: SIAM CSE 2015
R Cyriac, JC Dietrich+, RA Luettich Jr, JG Fleming, BO Blanton. “Strengthening the Hurricane Wave and Surge Forecast Guidance provided to Coastal Communities in North Carolina.” SIAM Conference on Computational Science and Engineering, Salt Lake City, Utah, 16-17 March 2015.
+ Presenter, if other than first author.
News: Developing Storm Surge Visualization
2015/03/10 – CCEE
Developing Storm Surge Visualization
Developing Storm Surge Visualization

When tropical storms approach, local, state and federal emergency managers seek predictions of storm surge and coastal flooding. In a project supported by NC Sea Grant, Dr. Casey Dietrich and Ph.D. student Rosemary Cyriac are improving the dissemination of flooding predictions to end-users by producing predictions in popular file formats. The Coastal Emergency Risk Assessment (CERA, http://nc-cera.renci.org/) provides a Web-based interface for visualizing surge predictions from computer models. Dr. Dietrich’s team is working with emergency managers in North Carolina’s coastal counties and with other decision makers. Results from daily model simulations are sent to these individuals, and they are widely used to predict inundation and flooding levels. Such predictions are also needed for engineering design and evacuation decisions. Model outputs are converted into formats compatible with commonly used visualization software, such as ArcGIS and Google Earth. By providing predictions to local emergency managers in a useful format, the information can be more easily integrated with other data, thereby making the information more accessible to those who most need it.