As a point of discussion, please consider the following schematic of our hindcast validation of Hurricane Katrina:
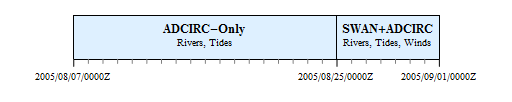
In our hurricane hindcasts, such as the validations of Katrina and Rita described in papers to be published in Monthly Weather Review, the simulations are performed in two stages. First, a spin-up simulation is run for several days before the start of the hurricane winds, so that the tides and rivers can reach a dynamic equilibrium in the resonant basin of the Gulf of Mexico. Then the solution from that spin-up simulation is used as the initial condition for the hurricane hindcast simulation. For example, for Katrina, we employ an 18-day, tides/rivers spin-up simulation that starts on 07 August 2005, and then we run a 7-day, hurricane simulation that starts on 25 August 2005. The solution from the spin-up simulation is used to hot-start the hurricane simulation.
There are two ways in which the coupled SWAN+ADCIRC could be hot-started during this hindcast. First, it is always hot-started at the beginning of its simulation, at 2005/08/25/0000Z. Although SWAN is not run during the tides/rivers spin-up simulation, because its action is forced entirely by the hurricane winds, we do run ADCIRC during that stage. Thus, when the coupled SWAN+ADCIRC model is employed in the second stage, we must hot-start the ADCIRC half of the simulation. SWAN starts from scratch at the beginning of the hurricane simulation.
Second, we may need to hot-start at some time during the SWAN+ADCIRC stage if it ended abruptly, due to machine failure, user interruption, etc. Instead of re-starting that stage at its beginning, we would rather hot-start in the middle. Then both SWAN and ADCIRC would need to be hot-started, using an intermediate solution as an initial condition for the remainder of the simulation.
Thus, there are two distinct methods in which SWAN+ADCIRC might be hot-started. The first method, in which SWAN is cold-started and ADCIRC is hot-started, would occur in the transition between simulations in the Katrina hindcast. The second method would hot-start both SWAN and ADCIRC, such as at some intermediate time during the second stage of the Katrina hindcast. Instructions for both methods are included below.
 Hurricanes Katrina and Rita were powerful storms that impacted southern Louisiana and Mississippi during the 2005 hurricane season. In Part I, the authors describe and validate a high-resolution coupled riverine flow, tide, wind, wave, and storm surge model for this region. Herein, the model is used to examine the evolution of these hurricanes in more detail. Synoptic histories show how storm tracks, winds, and waves interacted with the topography, the protruding Mississippi River delta, east-west shorelines, man-made structures, and low-lying marshes to develop and propagate storm surge. Perturbations of the model, in which the waves were not included, show the proportional importance of the wave radiation stress gradient induced setup.
 A coupled system of wind, wind wave, and coastal circulation models has been implemented for southern Louisiana and Mississippi to simulate riverine flows, tides, wind waves, and hurricane storm surge in the region. The system combines the NOAA Hurricane Research Division Wind Analysis System (H*WIND) and the Interactive Objective Kinematic Analysis (IOKA) kinematic wind analyses, the Wave Model (WAM) offshore and Steady-State Irregular Wave (STWAVE) nearshore wind wave models, and the Advanced Circulation (ADCIRC) basin to channel-scale unstructured grid circulation model. The system emphasizes a high-resolution (down to 50m) representation of the geometry, bathymetry, and topography; nonlinear coupling of all processes including wind wave radiation stress-induced set up; and objective specification of frictional parameters based on land-cover databases and commonly used parameters. Riverine flows and tides are validated for no storm conditions, while winds, wind waves, hydrographs, and high water marks are validated for Hurricanes Katrina and Rita.
 Hurricane Katrina caused devastating flooding in St. Bernard Parish, Louisiana. Storm surge surrounded the polder that comprises heavily populated sections of the Parish in addition to the Lower 9th Ward section of Orleans Parish. Surge propagated along several pathways to reach levees and walls around the polder’s periphery. Extreme water levels led to breaches in the levee/wall system which, along with wave overtopping and steady overflow, led to considerable flood water entering the polder. Generation and evolution of the storm surge as it propagated into the region is examined using results from the SL15 regional application of the ADCIRC storm surge model. Fluxes of water into the region through navigation channels are compared to fluxes which entered through Lake Borgne and over inundated wetlands surrounding the lake. Fluxes through Lake Borgne and adjacent wetlands were found to be the predominant source of water reaching the region. Various sources of flood water along the polder periphery are examined. Flood water primarily entered through the east and west sides of the polder. Different peak surges and hydrograph shapes were experienced along the polder boundaries, and reasons for the spatial variability in surge conditions are discussed.
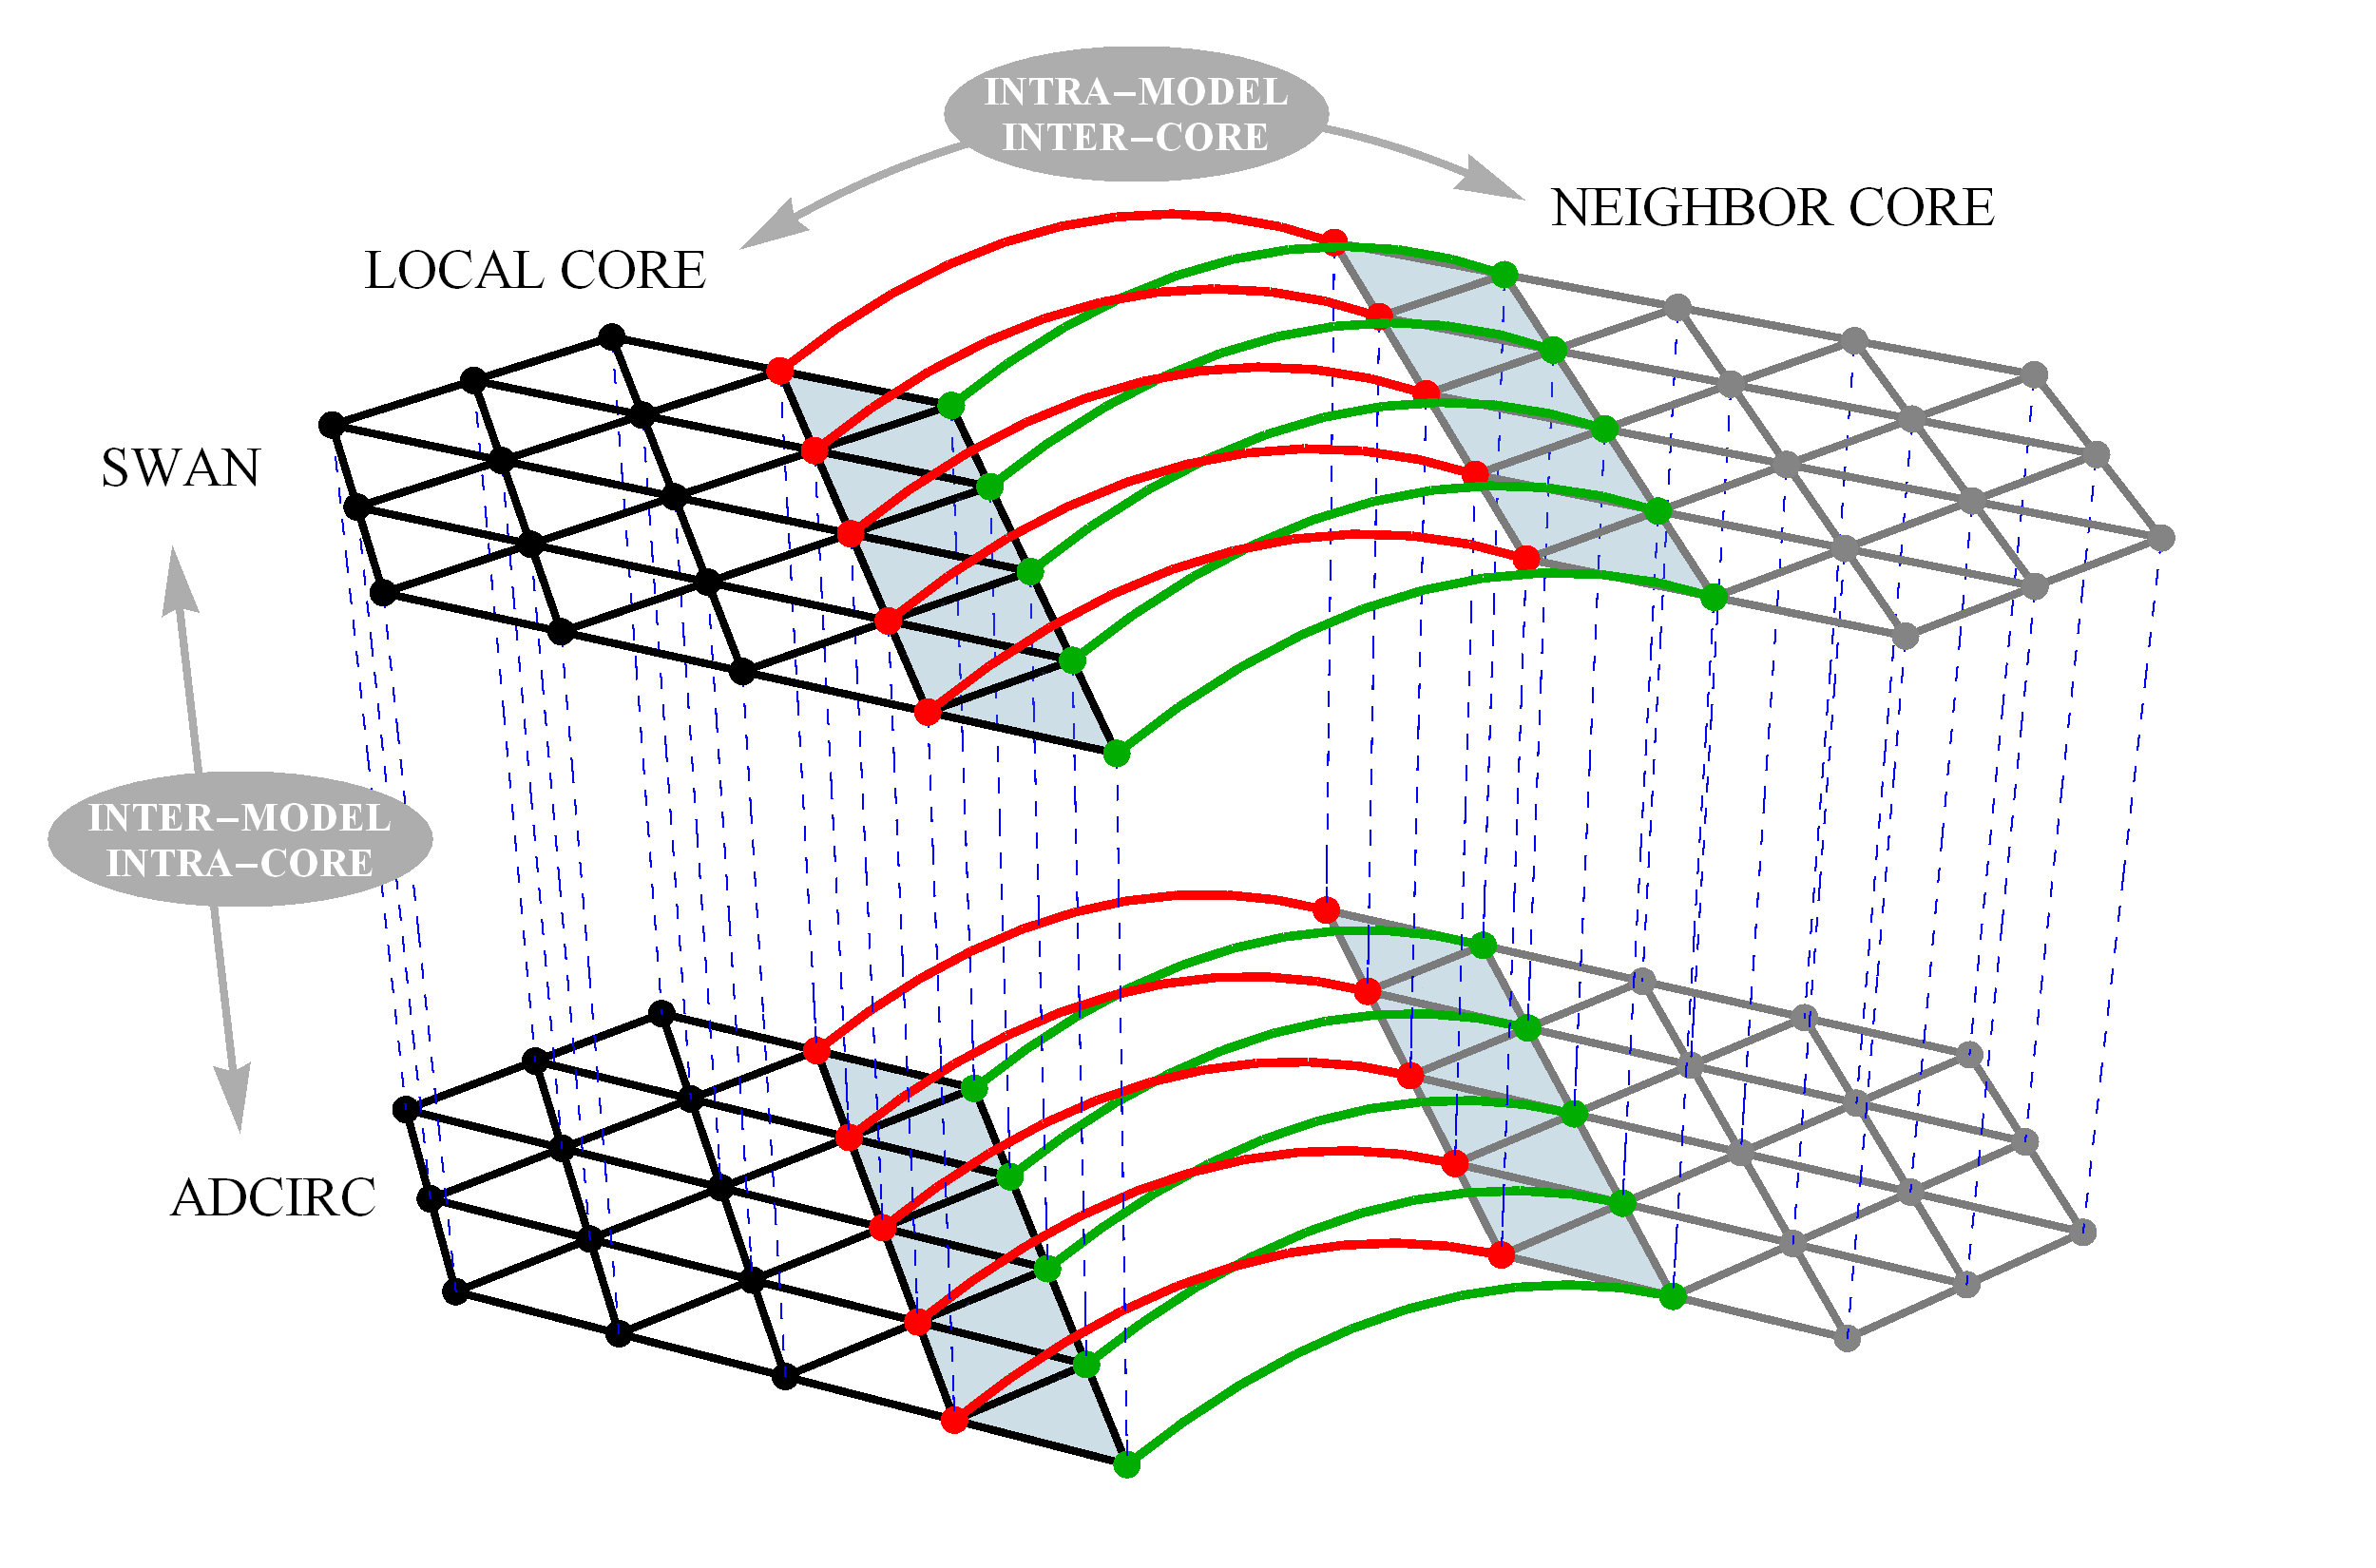
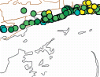
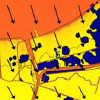
 It emphasizes our transition from the loose coupling with structured-mesh wave models to the tight coupling with the unstructured-mesh version of SWAN. The rectangle in the upper right and the triangle in the lower left are meant to “pop” from the sides of the poster, as shown in the picture to the right. By running on the same unstructured mesh, SWAN and ADCIRC can pass information locally, on the same core or across inter-core boundaries, without the need for global communication.