Updated 2012/06/05: This version of FigureGen has become outdated, but is maintained on this page for reference. Please click here to be redirected to the newest version.
FigureGen is a FORTRAN program that creates images for ADCIRC files. It reads output files (fort.63, fort.64, maxele.63, etc.), grid files (fort.14, etc.), nodal attributes files (fort.13), etc. It plots contours, contour lines, and vectors. Using FigureGen, you can go directly from the ADCIRC input and output files to a presentation-quality figure, for one or multiple time snaps, without having to use SMS.
The following example depicts the water levels in ArcGIS as Ike moved through the Gulf:
Contours of water levels (m) in the Gulf of Mexico during Ike (2008), as visualized in ArcGIS.
This program started from a script written by Brian Blanton, and it contains code written by John Atkinson, Howard Lander, Chris Szpilka, Zach Cobell, and others. I converted it to FORTRAN because I am more familiar with that language, and I added the capability to plot vectors, among other things. But, at its core, FigureGen behaves like a script, and it uses system calls to tell other software how to generate the figure(s).
Continue reading →


 A coupled system of wind, wind wave, and coastal circulation models has been implemented for southern Louisiana and Mississippi to simulate riverine flows, tides, wind waves, and hurricane storm surge in the region. The system combines the NOAA Hurricane Research Division Wind Analysis System (H*WIND) and the Interactive Objective Kinematic Analysis (IOKA) kinematic wind analyses, the Wave Model (WAM) offshore and Steady-State Irregular Wave (STWAVE) nearshore wind wave models, and the Advanced Circulation (ADCIRC) basin to channel-scale unstructured grid circulation model. The system emphasizes a high-resolution (down to 50m) representation of the geometry, bathymetry, and topography; nonlinear coupling of all processes including wind wave radiation stress-induced set up; and objective specification of frictional parameters based on land-cover databases and commonly used parameters. Riverine flows and tides are validated for no storm conditions, while winds, wind waves, hydrographs, and high water marks are validated for Hurricanes Katrina and Rita.
 Hurricane Katrina caused devastating flooding in St. Bernard Parish, Louisiana. Storm surge surrounded the polder that comprises heavily populated sections of the Parish in addition to the Lower 9th Ward section of Orleans Parish. Surge propagated along several pathways to reach levees and walls around the polder’s periphery. Extreme water levels led to breaches in the levee/wall system which, along with wave overtopping and steady overflow, led to considerable flood water entering the polder. Generation and evolution of the storm surge as it propagated into the region is examined using results from the SL15 regional application of the ADCIRC storm surge model. Fluxes of water into the region through navigation channels are compared to fluxes which entered through Lake Borgne and over inundated wetlands surrounding the lake. Fluxes through Lake Borgne and adjacent wetlands were found to be the predominant source of water reaching the region. Various sources of flood water along the polder periphery are examined. Flood water primarily entered through the east and west sides of the polder. Different peak surges and hydrograph shapes were experienced along the polder boundaries, and reasons for the spatial variability in surge conditions are discussed.
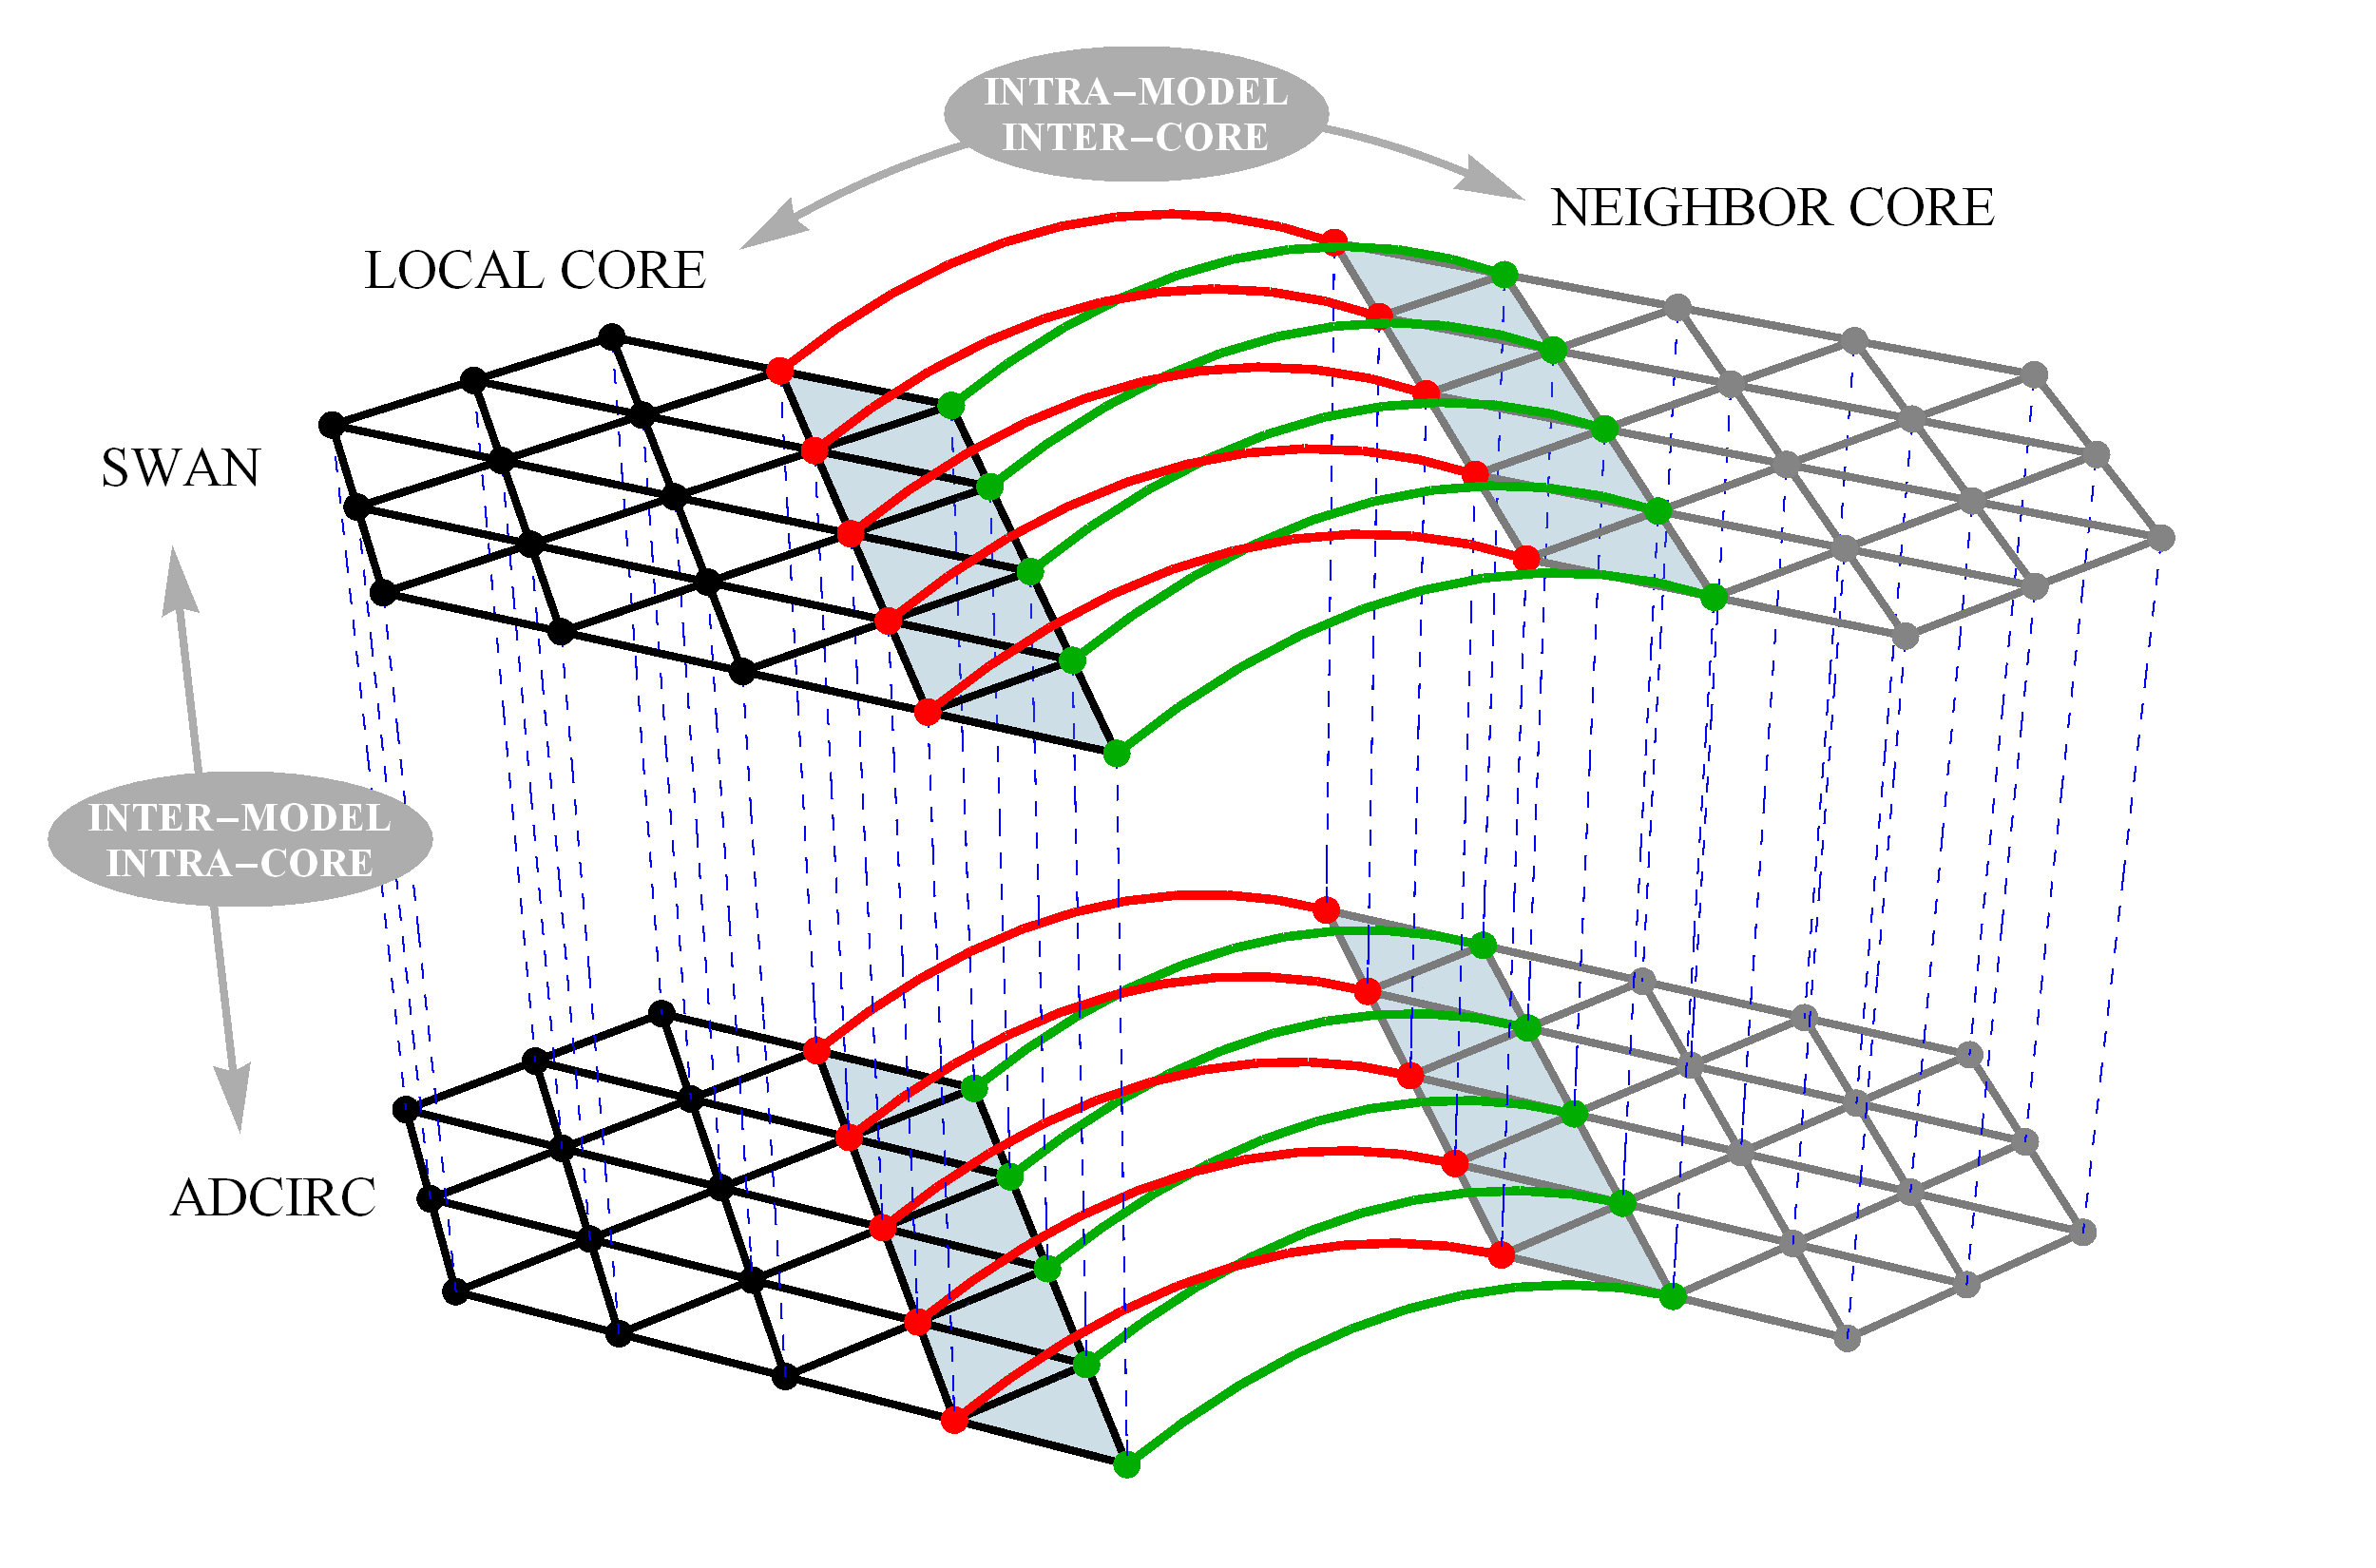
 It emphasizes our transition from the loose coupling with structured-mesh wave models to the tight coupling with the unstructured-mesh version of SWAN. The rectangle in the upper right and the triangle in the lower left are meant to “pop” from the sides of the poster, as shown in the picture to the right. By running on the same unstructured mesh, SWAN and ADCIRC can pass information locally, on the same core or across inter-core boundaries, without the need for global communication.