

Updated 2012/04/12: This is an old page. It persists on this site for posterity, but the information presented below is no longer up-to-date. When you are done here, then please click forward to this page, which describes how to control refraction errors with limiters on the spectral propagation velocities.
In a previous page on wave refraction, it was shown that mesh resolution plays an important role in how SWAN handles this physical process. If the mesh is resolved coarsely, then SWAN can refract too much energy, resulting in spikes in the wave solution. In our hurricane applications, we have observed spikes in the significant wave heights of 75m or larger, focused at only a few vertices, because the mesh in those regions does not resolve properly a shallow feature.
To address this problem, we added wave refraction as an attribute to the ADCIRC fort.13 file, so that it can be varied spatially. The user can enable refraction in regions with the necessary level of mesh resolution, and disable refraction in regions that are resolved coarsely. We enabled wave refraction along the northern Gulf coastline and within southern Louisiana, and we no longer saw the spikes in the significant wave heights in the regions offshore.
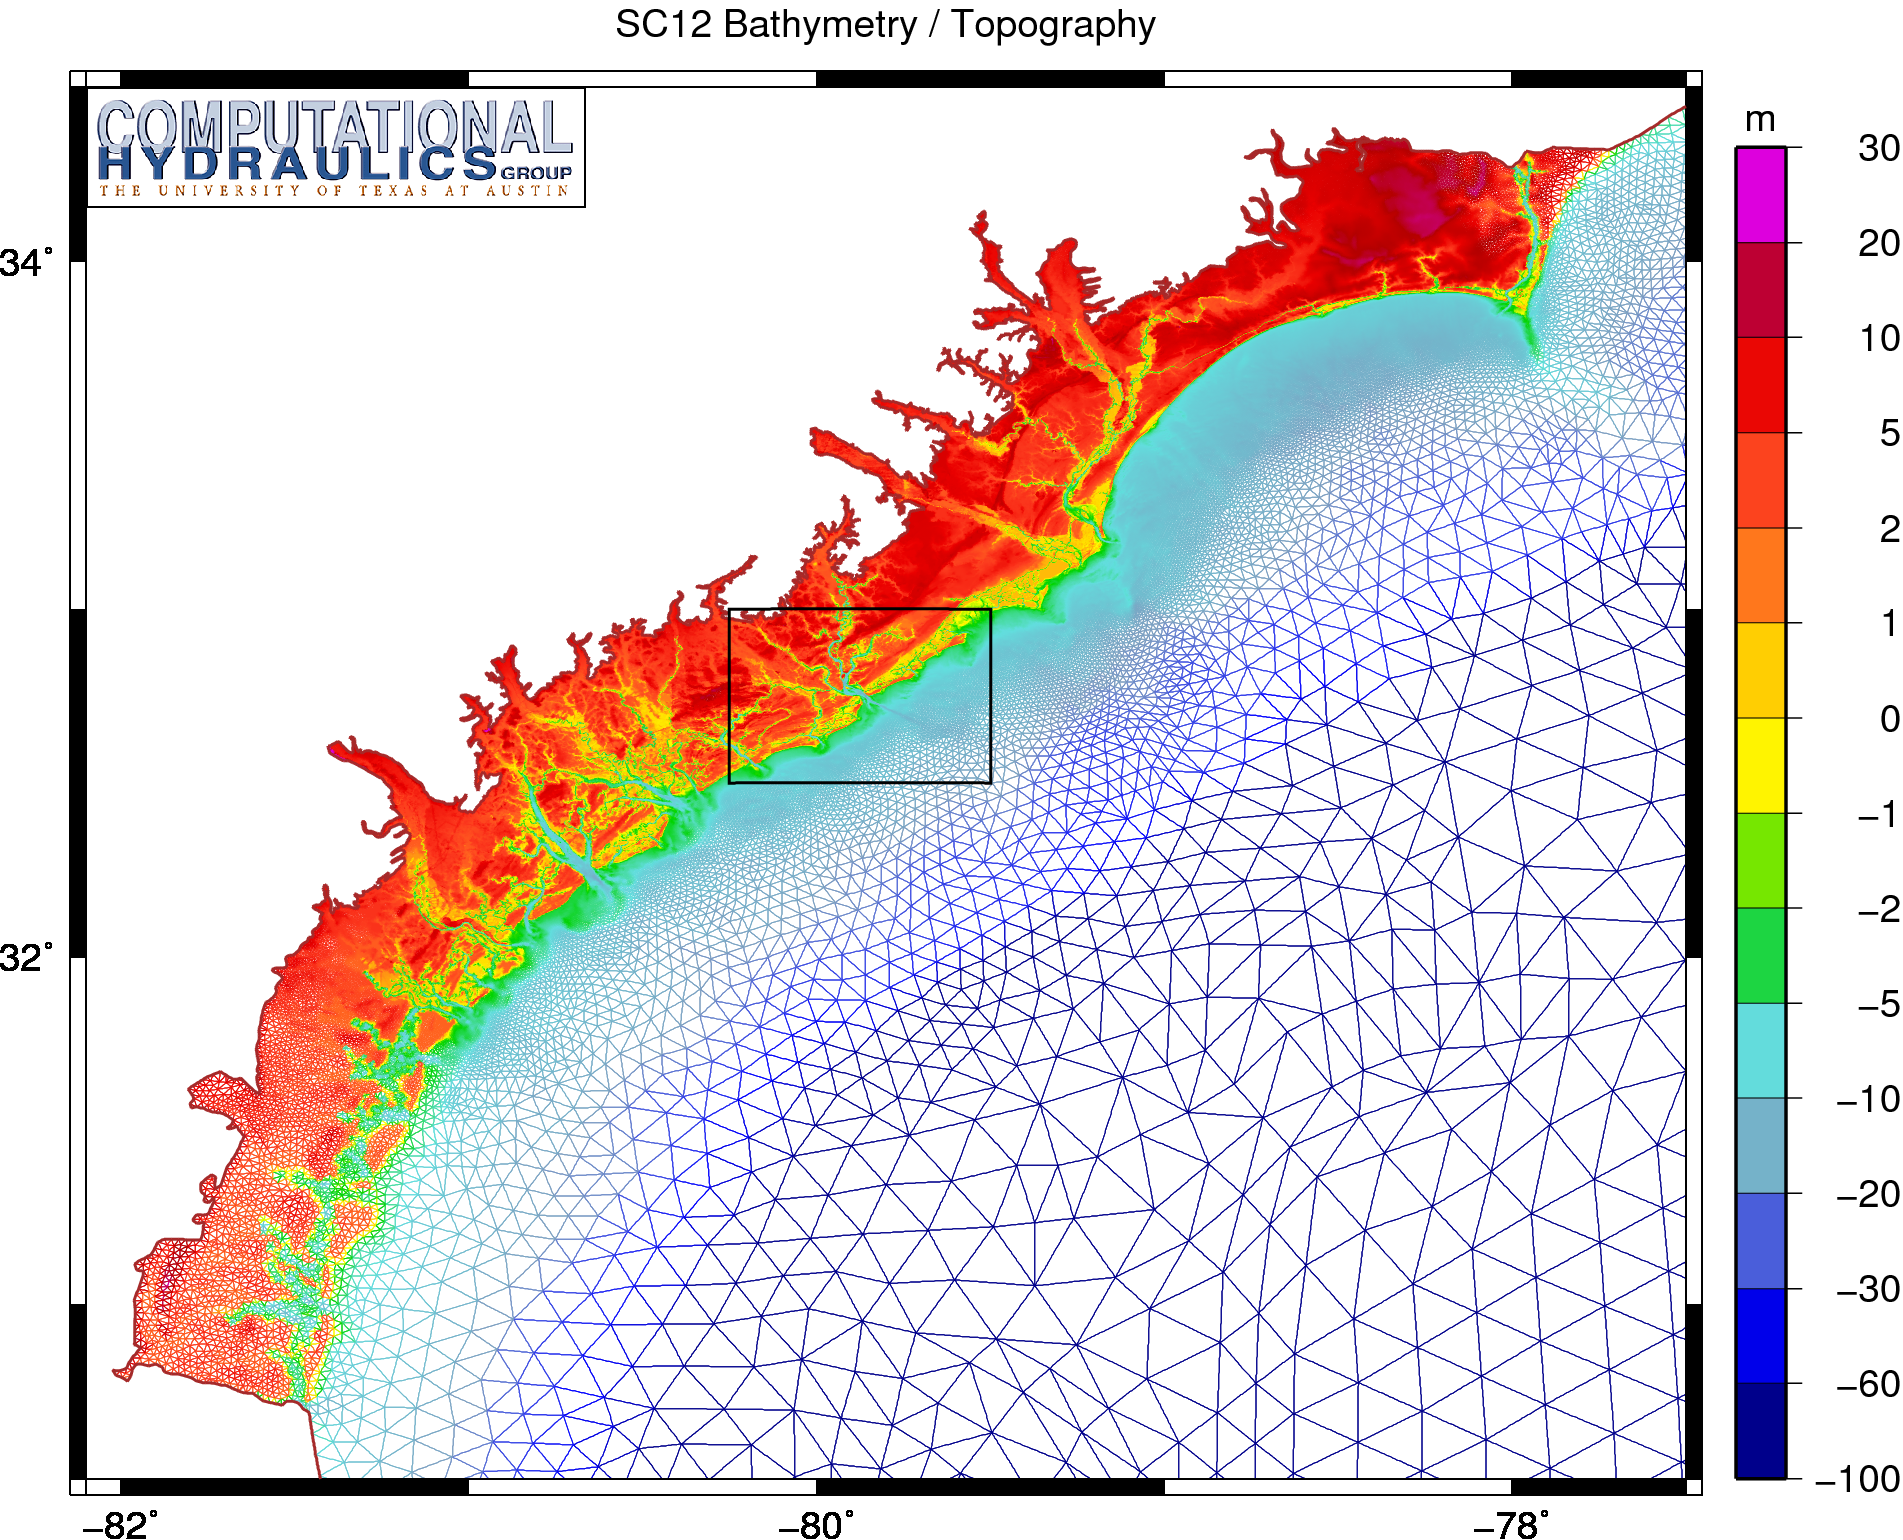
Bathymetry and topography (m) on the SC12 unstructured mesh.
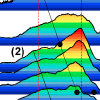
Peak Periods TPS in South Carolina
However, we have learned recently that wave refraction on coarse meshes can be problematic in other ways besides creating spikes in the significant wave heights. For example, in very shallow regions, the dissipation of bottom friction and breaking would limit the significant wave heights to reasonable values, even if wave refraction was a problem. There would not be any spikes in the significant wave heights. But the focusing of wave energy would be apparent in other ways that are more subtle, such as the existence of peak periods with the maximum possible values.
On this page, we examine an instance of this problem with wave refraction on coase meshes. As a specific example, we consider a mesh that was developed for a flood inundation study along the coastline of South Carolina. It should be noted that, although this example mesh does exhibit these problems with wave refraction, the problems are also evident on other meshes and other applications. For example, we have seen similarly problematic peak periods in our hurricane applications in southern Louisiana. As we have noted previously, any wave model would face this problem of how to handle refraction on unstructured meshes.
 A large, unpredicted, water level increase appeared along a substantial section of the western Louisiana and northern Texas (LATEX) coasts 12-24 hrs in advance of the landfall of Hurricane Ike (2008), with water levels in some areas reaching 3m above mean sea level. During this time the cyclonic wind field was largely shore parallel throughout the region. A similar early water level rise was reported for both the 1900 and the 1915 Galveston Hurricanes. The Ike forerunner anomaly occurred over a much larger area and prior to the primary coastal surge which was driven by onshore directed winds to the right of the storm track. We diagnose the forerunner surge as being generated by Ekman setup on the wide and shallow LATEX shelf. The longer forerunner time scale additionally served to increase water levels significantly in narrow-entranced coastal bays. The forerunner surge generated a freely propagating continental shelf wave with greater than 1.4m peak elevation that travelled coherently along the coast to Southern Texas, and was 300km in advance of the storm track at the time of landfall. This was, at some locations, the largest water level increase seen throughout the storm, and appears to be the largest freely-propagating shelf wave ever reported. Ekman setup-driven forerunners will be most significant on wide, shallow shelves subject to large wind fields, and need to be considered for planning and forecasting in these cases.
 The unstructured-mesh SWAN spectral wave model and the ADCIRC shallow-water circulation model have been integrated into a tightly-coupled SWAN+ADCIRC model. The model components are applied to an identical, unstructured mesh; share parallel computing infrastructure; and run sequentially in time. Wind speeds, water levels, currents and radiation stress gradients are vertex-based, and therefore can be passed through memory or cache to each model component. Parallel simulations based on domain decomposition utilize identical sub-meshes, and the communication is highly localized. Inter-model communication is intra-core, while intra-model communication is inter-core but is local and efficient because it is solely on adjacent sub-mesh edges. The resulting integrated SWAN+ADCIRC system is highly scalable and allows for localized increases in resolution without the complexity or cost of nested meshes or global interpolation between heterogeneous meshes. Hurricane waves and storm surge are validated for Hurricanes Katrina and Rita, demonstrating the importance of inclusion of the wave-circulation interactions, and efficient performance is demonstrated to 3062 computational cores.
 Coastal Louisiana and Mississippi are especially prone to large hurricanes due to their geographic location in the north-central Gulf of Mexico. Several recent hurricanes have devastated the region, creating complicated environments of waves and storm surge. Katrina (2005) and Gustav (2008) made landfall in southeastern Louisiana, and their counter-clockwise winds pushed surge onto the Louisiana-Mississippi continental shelf, into the low-lying wetlands surrounding the Mississippi River, and over and through the levee system that protects metropolitan New Orleans. Rita (2005) and Ike (2008) passed farther to the west, moved across the Texas-Louisiana continental shelf, and created surge that flooded large portions of southwestern Louisiana.