

Category Archives: Software
News: Enhancing Storm Surge Visualization
2017/10/04 – Science Node
The aim of storm surge models: When a storm approaches, emergency managers want fast and accurate forecasts
The aim of storm surge models: When a storm approaches, emergency managers want fast and accurate forecasts
![]()
Although our model provides water level predictions from the deep ocean all the way to the coastal floodplains, the system is limited by the model’s resolution. Topographic features at scales smaller than 500 feet, such as roadways or narrow stream channels, are often not included in the models because of the computer time needed to produce such high-resolution outputs. Because of this limitation, the extent of flooding can be underpredicted by the model.
2017/08/31 – National Consortium for Data Science
Data Fellows project aims to make storm surge predictions faster and more accurate

Continuing our North Carolina Sea Grant project and with new support from the National Consortium of Data Science, we are developing a method to improve prediction of the true flooding extent by combining the results of our model with more accurate elevation datasets.
To perform this prediction of the flooding extent, we use a Geographic Information System (GIS) called GRASS GIS that specializes in processing very large amounts of data. The project has two major objectives. The first is to process the modeled water levels and the elevation data set together, producing a map showing the extent of predicted flooding. When the modeled water levels are greater than the land elevation, flooding extends outward into neighboring, unflooded areas in the data set. By mapping the model results to the higher resolution data sets on elevation, we can create more accurate surge forecasts of overland flooding.
2017/08/08 – NC Sea Grant Coastwatch Currents
Fast, Accurate Forecasts of Coastal Flooding: Enhancing Visualization of Storm Surge Guidance to Support Emergency Managers
 Storm surge models must be both fast and accurate to give coastal communities the guidance they need to prepare for and respond to a storm. Perhaps just as important is the need for these forecasts to be visualized in a way that is meaningful and useable by emergency managers.
ADCIRC forecasts are currently visualized using Kalpana, a Python script that converts the model output into formats compatible with commonly-used visualization applications such as ArcGIS and Google Earth. With support from the National Consortium of Data Science (NCDS) and in partnership with North Carolina Emergency Management (NCEM), our team has developed a new visualization method that makes use of enhanced topographic resolution along the flooding boundary. This results in modeled storm surge extending farther into estuaries and floodplains, increasing the accuracy of the forecast.
How to Run Kalpana
Kalpana converts ADCIRC output files in netCDF format to Google Earth (kmz) or GIS shapefiles for use with conventional GIS software. The latest version of the code is maintained at our GitHub repository: https://github.com/ccht-ncsu/Kalpana.
Command line arguments control the way it produces output, including the number of contour levels, their values, and the color scale. When these specifications are absent from the command line, it uses reasonable default settings so in many cases only a few of the available command line options will be used for any particular plot.
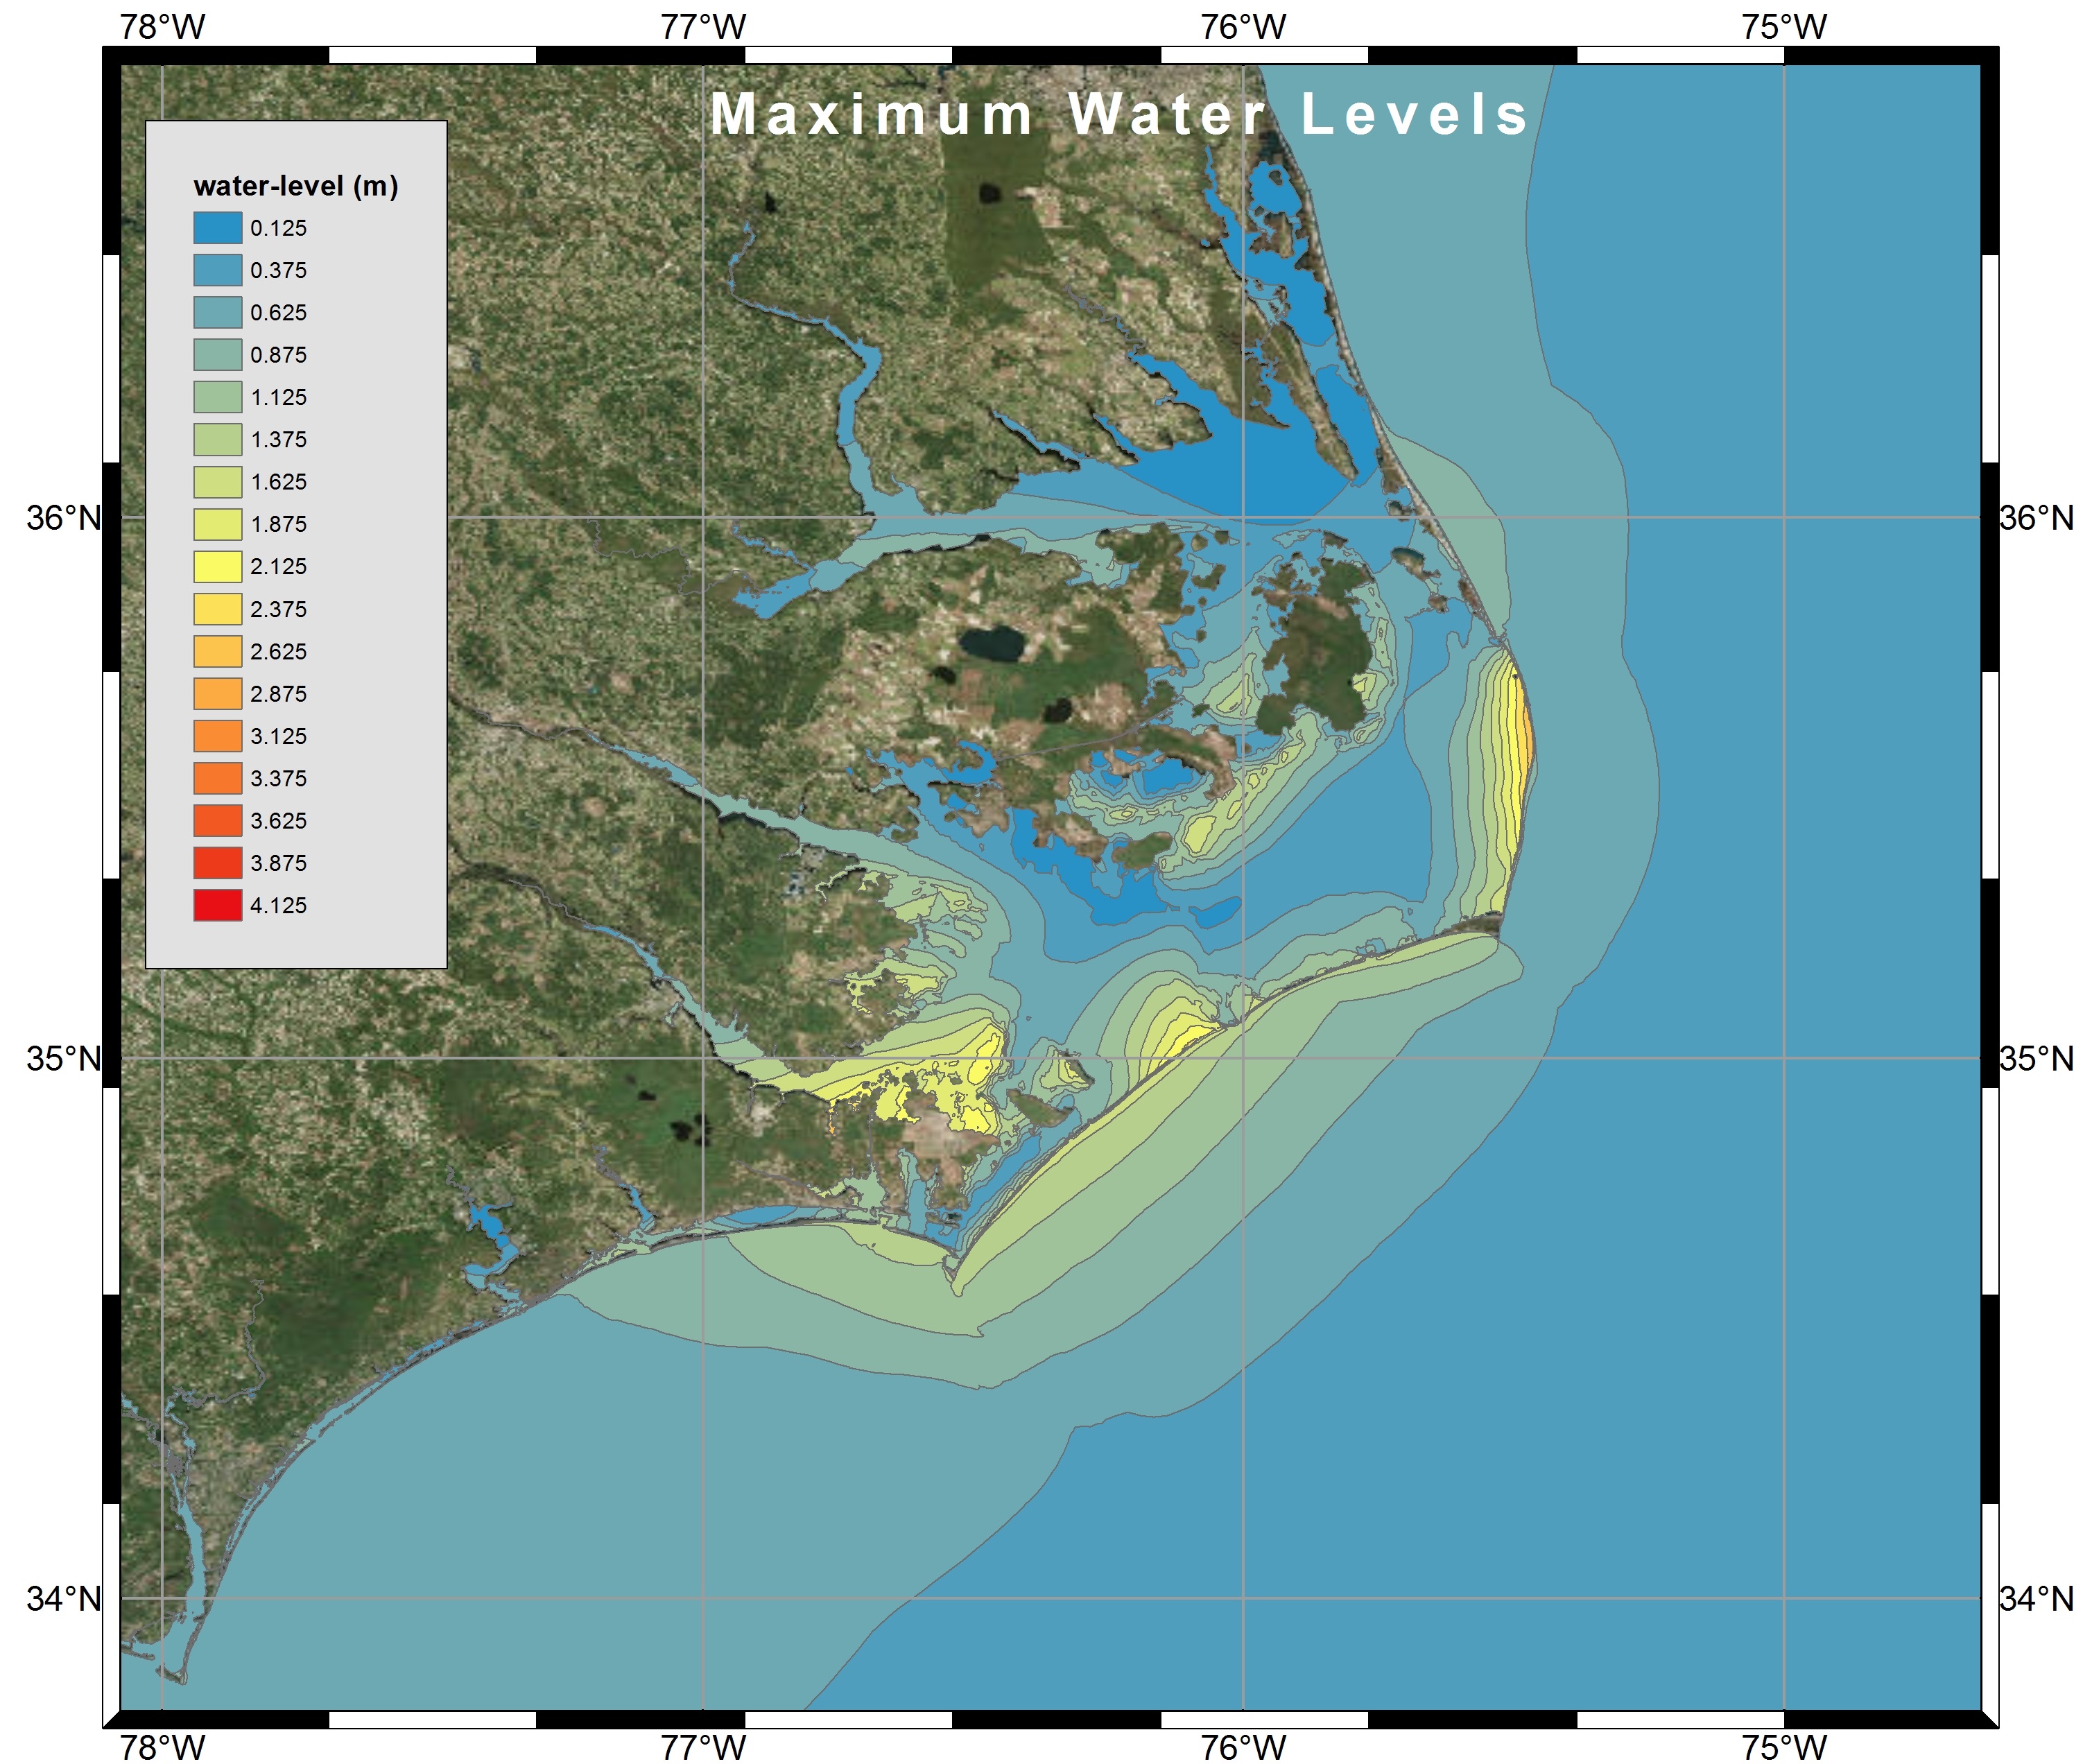
Visualization of Maximum Water Levels along the North Carolina coast during Hurricane Arthur (2014) using polygon shapefiles created by Kalpana with ArcGIS satellite imagery.
Recent Improvements to Kalpana
This post was contributed by CCHT collaborator Jason Fleming. He revised the Kalpana script to improve its efficiency and utility.
In the process of working on Kalpana, one of the deliverables was to clean the code, where possible. The following improvements were made as part of this deliverable.
Notes on the Development of Kalpana
This document describes the methodology followed in kalpana.py for the creation of shape file and kml files. The sequence of steps involved has been grouped under related sub-headings for better comprehension. The terms in fixed width font refer to variable names in the code.
Installing Python Modules for Kalpana
This post was contributed by CCHT collaborator Jason Fleming. This is a LONG post, but as he notes, it is a stream of consciousness about how he compiled the modules needed by Kalpana. Hopefully his experience will be helpful to new users. After the modules have been compiled, then Kalpana is very easy to use. So please don’t be discouraged!
The actual script kalapana.py does not require installation, it is merely executed. However, it relies on several Python modules that most users (or their IT supporters) will need to install before working with Kalpana. These modules are:
matplotlib– main python module used for data visualization.pylab– Imports plotting and numerics libraries in a single name space.shapely– used to construct geometric objects like Points, Polygons and LineStrings.fiona– for writing .shp files.netCDF4– reading and writing netCDF files.datetime– dates and time calculation, manipulation, and formatting.time– contains time related functions for measuring the performance of the code itself.numpy– to facilitate scientific computing; used primarily in Kalpana for working with n-dimensionalnumpyarrays, which are ideal for storing large amounts of data.collections– accessing OrderedDict, which is a dictionary subclass that remembers the order in which entries were added, whereas an ordinary dictionary does not do so).simplekml– writing kml (Google Earth) files.
In the process of installing Python modules on a desktop platform, as well as an HPC platform, I’ve found that the process can be very challenging. The biggest issue is conflicting module version dependencies, which can be handled by the use of virtual execution environments for Python (explained below).