

Category Archives: Software
Conference: ADCIRC 2015
Conference: SIAM CSE 2015
R Cyriac, JC Dietrich+, RA Luettich Jr, JG Fleming, BO Blanton. “Strengthening the Hurricane Wave and Surge Forecast Guidance provided to Coastal Communities in North Carolina.” SIAM Conference on Computational Science and Engineering, Salt Lake City, Utah, 16-17 March 2015.
+ Presenter, if other than first author.
News: Developing Storm Surge Visualization
2015/03/10 – CCEE
Developing Storm Surge Visualization
Developing Storm Surge Visualization

When tropical storms approach, local, state and federal emergency managers seek predictions of storm surge and coastal flooding. In a project supported by NC Sea Grant, Dr. Casey Dietrich and Ph.D. student Rosemary Cyriac are improving the dissemination of flooding predictions to end-users by producing predictions in popular file formats. The Coastal Emergency Risk Assessment (CERA, http://nc-cera.renci.org/) provides a Web-based interface for visualizing surge predictions from computer models. Dr. Dietrich’s team is working with emergency managers in North Carolina’s coastal counties and with other decision makers. Results from daily model simulations are sent to these individuals, and they are widely used to predict inundation and flooding levels. Such predictions are also needed for engineering design and evacuation decisions. Model outputs are converted into formats compatible with commonly used visualization software, such as ArcGIS and Google Earth. By providing predictions to local emergency managers in a useful format, the information can be more easily integrated with other data, thereby making the information more accessible to those who most need it.
Poster: NCSU Symposiums 2015
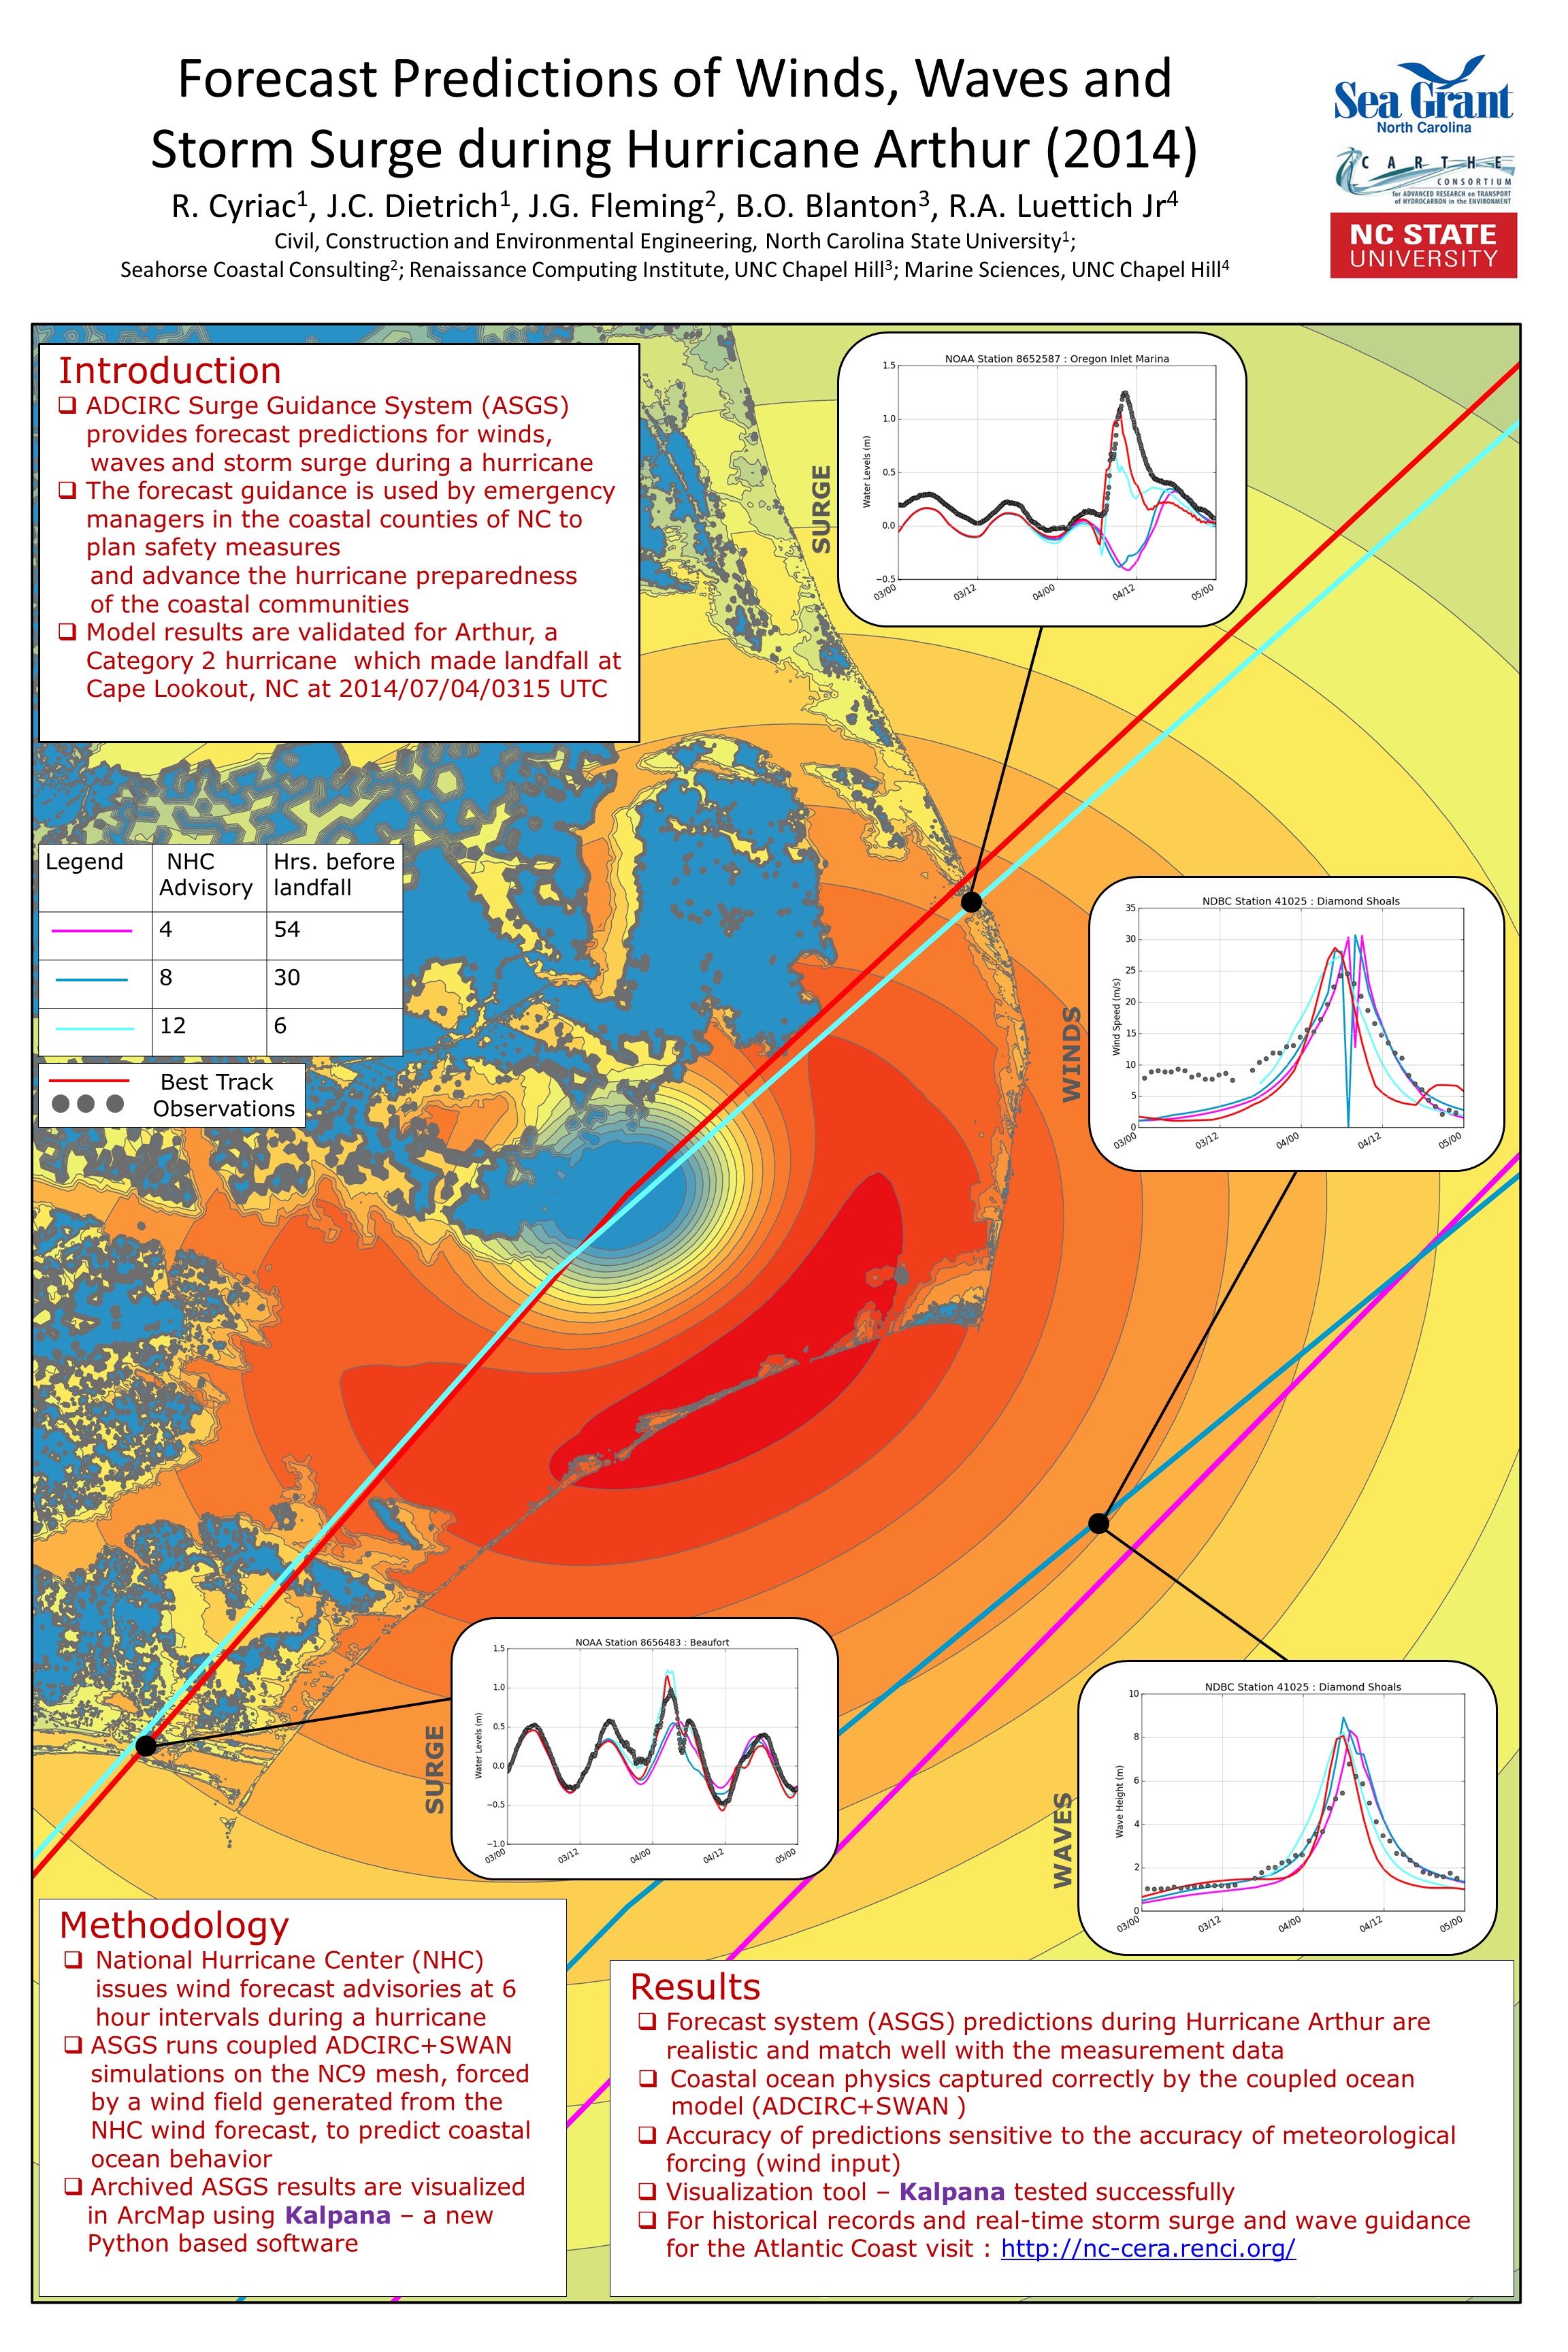
R Cyriac, JC Dietrich, JG Fleming, BO Blanton, RA Luettich, C Kaiser. “Forecast Predictions of Winds, Waves and Storm Surge during Hurricane Arthur (2014).” Graduate Student Research Symposium, North Carolina State University, 25 March 2015.
R Cyriac, JC Dietrich, JG Fleming, BO Blanton, RA Luettich, C Kaiser. “Forecast Predictions of Winds, Waves and Storm Surge during Hurricane Arthur (2014).” Environmental, Water Resources and Coastal Engineering Research Symposium, North Carolina State University, 06 March 2015.
Seminar: Old Dominion University
News: Developing Storm Surge Visualization
2014/10/29 – NC Sea Grant Coastwatch Currents
Picture This: Developing Storm Surge Visualization
Picture This: Developing Storm Surge Visualization

When a tropical storm or hurricane develops in the open ocean, the National Hurricane Center, known as NHC, issues advisories that anticipate the track and intensity of the wind field. These advisories predict when and where the hurricane is expected to make landfall, even when the storm is far away from the coast.
This information serves as an input for the ocean model, which then predicts the water levels or storm surges, and wave heights created by these winds at various locations along our coastline for the coming days. These results will convey a greater meaning to the end user when visualized properly. The chief objective for our project is to improve the communication of these model outputs to the end-user by producing them in popular file formats like that of GIS based shapefiles and KMZ files used in Google Earth.
Real-Time Forecasting and Visualization of Hurricane Waves and Storm Surge Using SWAN+ADCIRC and FigureGen
 Storm surge due to hurricanes and tropical storms can result in significant loss of life, property damage, and long-term damage to coastal ecosystems and landscapes. Computer modeling of storm surge is useful for two primary purposes: forecasting of storm impacts for response planning, particularly the evacuation of vulnerable coastal populations; and hindcasting of storms for determining risk, development of mitigation strategies, coastal restoration, and sustainability. Model results must be communicated quickly and effectively, to provide context about the magnitudes and locations of the maximum waves and surges in time for meaningful actions to be taken in the impact region before a storm strikes.
In this paper, we present an overview of the SWAN+ADCIRC modeling system for coastal waves and circulation. We also describe FigureGen, a graphics program adapted to visualize hurricane waves and storm surge as computed by these models. The system was applied recently to forecast Hurricane Isaac (2012) as it made landfall in southern Louisiana. Model results are shown to be an accurate warning of the impacts of waves and circulation along the northern Gulf coastline, especially when communicated to emergency managers as geo-referenced images.