

N Tull, JC Dietrich+, TE Langan, H Mitasova, CA Rucker, BO Blanton, JG Fleming, RA Luettich. “Downscaling and Extrapolation of Coastal Flooding Forecasts for Decision Support.” Geospatial Forum, Center for Geospatial Analytics, North Carolina State University, Raleigh, North Carolina, 18 October 2018.
Category Archives: Kalpana
Presentation: NC Sea Grant Site Review
Dissertation Defense: Rosemary Cyriac
Variability in Coastal Flooding Predictions due to Forecast Errors during Hurricane Arthur
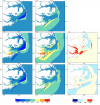 Storm surge prediction models rely on an accurate representation of the wind conditions. In this paper, we examine the sensitivity of surge predictions to forecast uncertainties in the track and strength of a storm (storm strength is quantified by the power dissipation of the associated wind field). This analysis is performed using Hurricane Arthur (2014), a Category 2 hurricane, which made landfall along the North Carolina (NC) coast in early July 2014. Hindcast simulations of a coupled hydrodynamic-wave model are performed on a large unstructured mesh to analyze the surge impact of Arthur along the NC coastline. The effects of Arthur are best represented by a post-storm data assimilated wind product with parametric vortex winds providing a close approximation. Surge predictions driven by forecast advisories issued by the National Hurricane Center (NHC) during Arthur are analyzed. The storm track predictions from the NHC improve over time. However, successive advisories predict an unrealistic increase in the storm’s strength. Due to these forecast errors, the global root mean square errors of the predicted wind speeds and water levels increase as the storm approaches landfall. The relative impacts of the track and strength errors on the surge predictions are assessed by replacing forecast storm parameters with the best known post-storm information about Arthur. In a “constant track” analysis, Arthur’s post storm determined track is used in place of the track predictions of the different advisories but each advisory retains its size and intensity predictions. In a “constant storm strength” analysis, forecast wind and pressure parameters are replaced by corresponding parameters extracted from the post storm analysis while each advisory retains its forecast storm track. We observe a strong correlation between the forecast errors and the wind speed predictions. However, the correlation between these errors and the forecast water levels is weak signifying a non-linear response of the shallow coastal waters to meteorological forcing.
Nelson wins Student Poster Award
MS student Nelson Tull won the Student Poster Award at the ASBPA National Coastal Conference 2017. This award is chosen by attendees from among all of the student posters and is reflective of both compelling research activities and excellent presentation skills.

Congratulations to Nelson!
Nelson Tull accepts the Student Poster Award during the awards luncheon at the ASBPA National Coastal Conference.