Numerical models such as SWAN and ADCIRC can be started in different ways. The typical start is “cold,” i.e. with all computed quantities set to zero, and then the solution is allowed to develop naturally as the various forcings are applied. However, it is also possible to apply a “hot” start, in which the solution from a previous simulation is used as an initial condition. This page describes how to hot-start the tightly-coupled SWAN+ADCIRC.
As a point of discussion, please consider the following schematic of our hindcast validation of Hurricane Katrina:
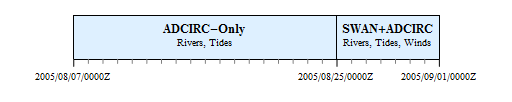
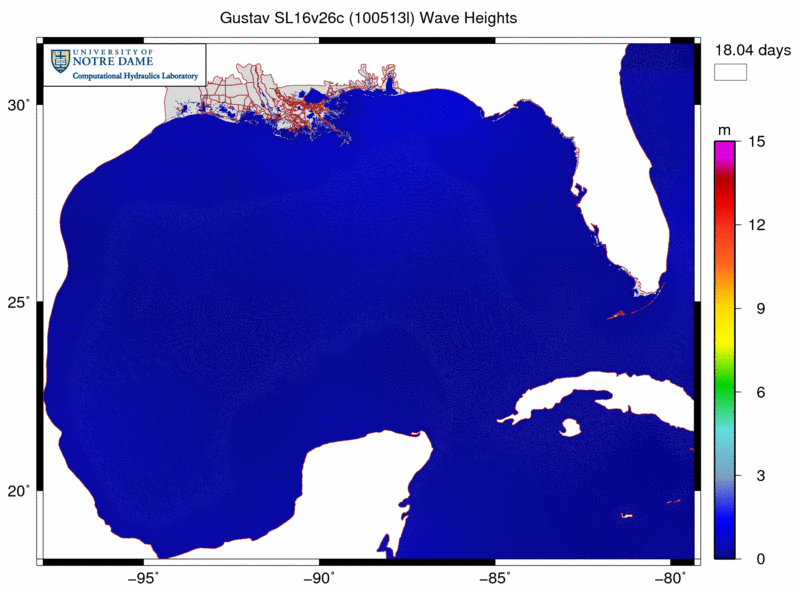
In our hurricane hindcasts, such as the validations of Katrina and Rita described in papers to be published in Monthly Weather Review, the simulations are performed in two stages. First, a spin-up simulation is run for several days before the start of the hurricane winds, so that the tides and rivers can reach a dynamic equilibrium in the resonant basin of the Gulf of Mexico. Then the solution from that spin-up simulation is used as the initial condition for the hurricane hindcast simulation. For example, for Katrina, we employ an 18-day, tides/rivers spin-up simulation that starts on 07 August 2005, and then we run a 7-day, hurricane simulation that starts on 25 August 2005. The solution from the spin-up simulation is used to hot-start the hurricane simulation.
There are two ways in which the coupled SWAN+ADCIRC could be hot-started during this hindcast. First, it is always hot-started at the beginning of its simulation, at 2005/08/25/0000Z. Although SWAN is not run during the tides/rivers spin-up simulation, because its action is forced entirely by the hurricane winds, we do run ADCIRC during that stage. Thus, when the coupled SWAN+ADCIRC model is employed in the second stage, we must hot-start the ADCIRC half of the simulation. SWAN starts from scratch at the beginning of the hurricane simulation.
Second, we may need to hot-start at some time during the SWAN+ADCIRC stage if it ended abruptly, due to machine failure, user interruption, etc. Instead of re-starting that stage at its beginning, we would rather hot-start in the middle. Then both SWAN and ADCIRC would need to be hot-started, using an intermediate solution as an initial condition for the remainder of the simulation.
Thus, there are two distinct methods in which SWAN+ADCIRC might be hot-started. The first method, in which SWAN is cold-started and ADCIRC is hot-started, would occur in the transition between simulations in the Katrina hindcast. The second method would hot-start both SWAN and ADCIRC, such as at some intermediate time during the second stage of the Katrina hindcast. Instructions for both methods are included below.
Continue reading →


 Few wave measurements have been made in wetlands during high-energy, surge events, such as hurricanes. During Hurricane Gustav in 2008, many nearshore wave measurements were made in Southeastern Louisiana. These data are used to verify a nearshore wave modeling system and to explore the characteristics of hurricane waves in wetlands. The modeling system consists of the wave generation model WAM, the nearhsore wave model STWAVE, and the circulation model ADCIRC. The measurements confirm reasonable success in modeling the waves. The measurements and modeling also expose some of the problems of measuring waves in highly-variable water depths under hurricane forcing and modeling waves in rapidly degrading wetlands.
 coefficients used by ADCIRC.
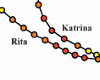 Hurricanes Katrina and Rita were powerful storms that impacted southern Louisiana and Mississippi during the 2005 hurricane season. In Part I, the authors describe and validate a high-resolution coupled riverine flow, tide, wind, wave, and storm surge model for this region. Herein, the model is used to examine the evolution of these hurricanes in more detail. Synoptic histories show how storm tracks, winds, and waves interacted with the topography, the protruding Mississippi River delta, east-west shorelines, man-made structures, and low-lying marshes to develop and propagate storm surge. Perturbations of the model, in which the waves were not included, show the proportional importance of the wave radiation stress gradient induced setup.