

Contours of water levels (m) and vectors of wind velocities (m/s) during Katrina (2005).
While finalizing our hindcasts of the four recent, major hurricanes to impact southern Louisiana (Katrina, Rita, Gustav and Ike), we implemented a variable wind drag coefficient that depends on wind speed and also location relative to storm movement. This work follows closely the azimuthal dependence of wind drag observed by Mark Powell (2006).
To transfer the momentum from the winds, ADCIRC applies a sea-surface momentum stress as:
(1) 
where  is the wind speed at 10m elevation, and
  is the wind drag coefficient. ADCIRC applies the wind drag coefficient from Garratt (1977):
(2) 
while SWAN applies a nearly-identical wind drag coefficient from Wu (1982):
(3) 
In the normal coupling of SWAN+ADCIRC, both models limit the wind drag coefficient to a maximum of  .
.
However, in reality, the drag coefficient is not only a function of wind speed. It also depends on the motion of the waves in relation to the winds. In regions where the winds and waves are moving in the same direction, the wind drag will be relatively small. But in regions where the winds are blowing opposite the waves, the wind drag will be larger due to the additional roughness of the sea surface.
This behavior can be parameterized by dividing the storm into sectors, relative to the storm’s movement (Black et al., 2007). This parameterization is shown below:
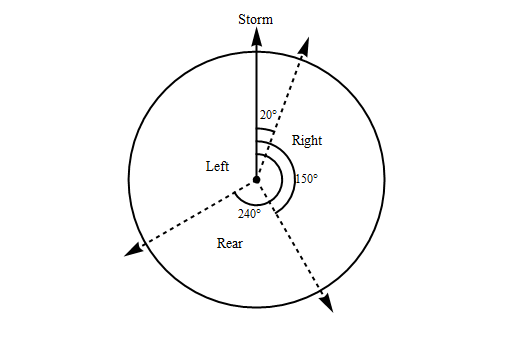
Definition of storm sectors from Black et al. (2007).
In the image above, the storm is assumed to be moving northward, and the sectors are drawn relative to that motion. In the right ( ) and rear (
 ) sectors, the winds are assumed to be moving generally with the waves. However, in the left (
 ) sector, the winds move counter to the waves, and thus the wind drag coefficient should be larger.
While implementing this parameterization in SWAN+ADCIRC, I ran tests using Katrina on our EC2001 mesh, which is relatively coarse (~250K mesh vertices) compared to the new SL16 mesh. The animation below depicts the sectors as Katrina moves through the Gulf of Mexico and makes landfall in southeastern Louisiana. When the sectors are shown as zero, the standard wind drag is applied with an upper limit of . Non-zero sectors correspond to right (1), rear (2) and left (3).
Storm sectors during Katrina (2005).
The frames in that animation are at hourly intervals, so the sectors seem to shift more than they actually do. But it is interesting to see them change as the hurricane moves through the system. ADCIRC locates the eye of the hurricane by searching the OWI wind fields for the minimum central pressure, and then it determine the storm’s movement by averaging the direction of the eye over three successive snaps in the wind fields. If the eye cannot be found, then it applies the default Garratt (1977) wind drag; that is why the sectors are shown as zero after the storm makes landfall.
It is also interesting to note the specific behavior of the sectors during Katrina. As the storm turns due northward and makes landfall in southeastern Louisiana, the left sector encompasses much of the region, including New Orleans and Lake Pontchartrain. The larger wind drag coefficients in the left sector will provide a boost to the water levels in this region, which is what we need, because we have been low traditionally at the observed high-water marks along the south shore of the lake.
The next step is to vary in the wind drag coefficients in these sectors. Powell (2006) dropped sondes to measure the wind behavior in various parts of storms, and he observed distinct behavior of the wind drag coefficients based on these sectors. We have parameterized those observations as shown below:

Variation of wind drag coefficient in storm sectors after Powell (2006).
This figure depicts the extreme variability in the wind drag coefficient based on the storm sectors. All three sectors begin with the default Garratt (1977) wind drag at very low wind speeds up to 18-19 m/s. In the left sector, the wind drag coefficient increases significantly to  at a wind speed of 30 m/s before decreasing at higher wind speeds.
In the right and rear sectors, the behavior is similar at low-to-medium wind speeds, with a limit of , but then the right sector experiences a boost in the wind drag coefficient to  at wind speeds between 35-45 m/s. This boost at the highest wind speeds is crucial during Katrina, which maintained winds of this strength as it moved through the Breton and Chandeleur Sounds. Those strong winds in the right sector pushed surge into Mississippi and Alabama.
Returning to our tests with Katrina on the EC2001 mesh, it is interesting to see the evolution of these wind drag coefficients. Now they are allowed to vary as a function of both wind speed and storm sector.
Evolution of wind drag coefficients during Katrina (2005).
The coefficients are smoothed across the sectors to avoid discontinuities, but there is still a lot of variability in the wind drag. In the left sector, the drag coefficients are much larger, because the wind speeds in this region are near 30-35 m/s for much of the storm. However, you also see a boost in the right sector because of the highest wind speeds in this part of the storm.
SWAN+ADCIRC now utilizes this sector-based wind drag scheme. ADCIRC reads the OWI wind fields and interpolates them to the unstructured mesh, and then it passes the wind speeds to SWAN. Then both models use the wind speeds to compute drag coefficients at every mesh vertex, based on location relative to the storm movement. This option can be enabled during compilation by adding the -DPOWELL flag to the cmplrflags.mk file.
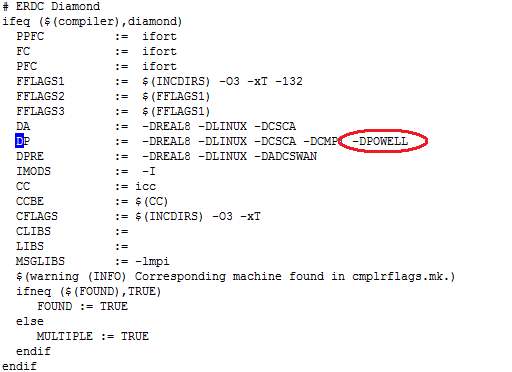
Compiler flag to activate the sector-based wind drag formulation. (This compiler flag is now outdated.)
When applied to one of our larger meshes, such as the simulation of Katrina on SL16 shown at the top of this page, this new wind drag scheme works well. In the right sector, the larger wind drag coefficients at the highest wind speeds provide a necessary boost to the surge along the Mississippi-Alabama coastline. And in the left sector, the larger wind drag coefficients at the intermediate wind speeds provide a necessary boost to the surge along the south shore of Lake Pontchartrain. The SWAN+ADCIRC hindcast of Katrina is better as a result of this new scheme.
The animation below shows the effect of the sector-based wind drag on the ADCIRC-computed water levels. It is shown as a difference between the Powell drag and the Garratt drag. Warm colors indicate regions where the sector-based wind drag scheme increases the water levels, while cooler colors indicate regions where it decreases the water levels. Note the additional surge along the south shore of Lake Pontchartrain and along the coastlines of Mississippi and Alabama.
Increase in water levels (m) during Katrina (2005) due to the sector-based wind drag formulation.
Future work would make use of the wave direction information that can be computed on the fly by SWAN. Instead of assuming the directional relationships of the winds and waves in the various sectors of the storm, we could actually compare the directions during the simulation. If the winds and waves were moving in opposite directions, then we could increase the wind drag coefficient in both models. The wind drag in ADCIRC would depend on the computed wave directions by SWAN.
References
P.G. Black, E.A. D’Asaro, W.M. Drennan, J.R. French, P.P Niiler, T.B. Sanford, E.J. Terrill, E.J. Walsh, J.A. Zhang (2007). “Air-sea exchange in hurricanes – Synthesis of observations from the coupled boundary layer air-sea transfer experiment.” Bulletin of the American Meteorological Society, 88(3) 357-374.
J.R. Garratt (1977). “Review of drag coefficients over oceans and continents.” Monthly Weather Review, 105, 915-929.
M.D. Powell (2006). “Final Report to the National Oceanic and Atmospheric Administration (NOAA) Joint Hurricane Testbed (JHT) Program.” 26 pp.
J. Wu (1982). “Wind-stress coefficients over sea surface from breeze to hurricane.” Journal of Geophysical Research, 87, C12, 9704-9706.