

Posters: EWC Symposium 2025
NK Arrigo, JC Dietrich, TC Massey. “Spatial controls and efficiency gains within a spectral wave model.” Environmental, Water Resources, and Coastal Engineering Graduate Research Symposium, North Carolina State University, 21 Mar 2025.
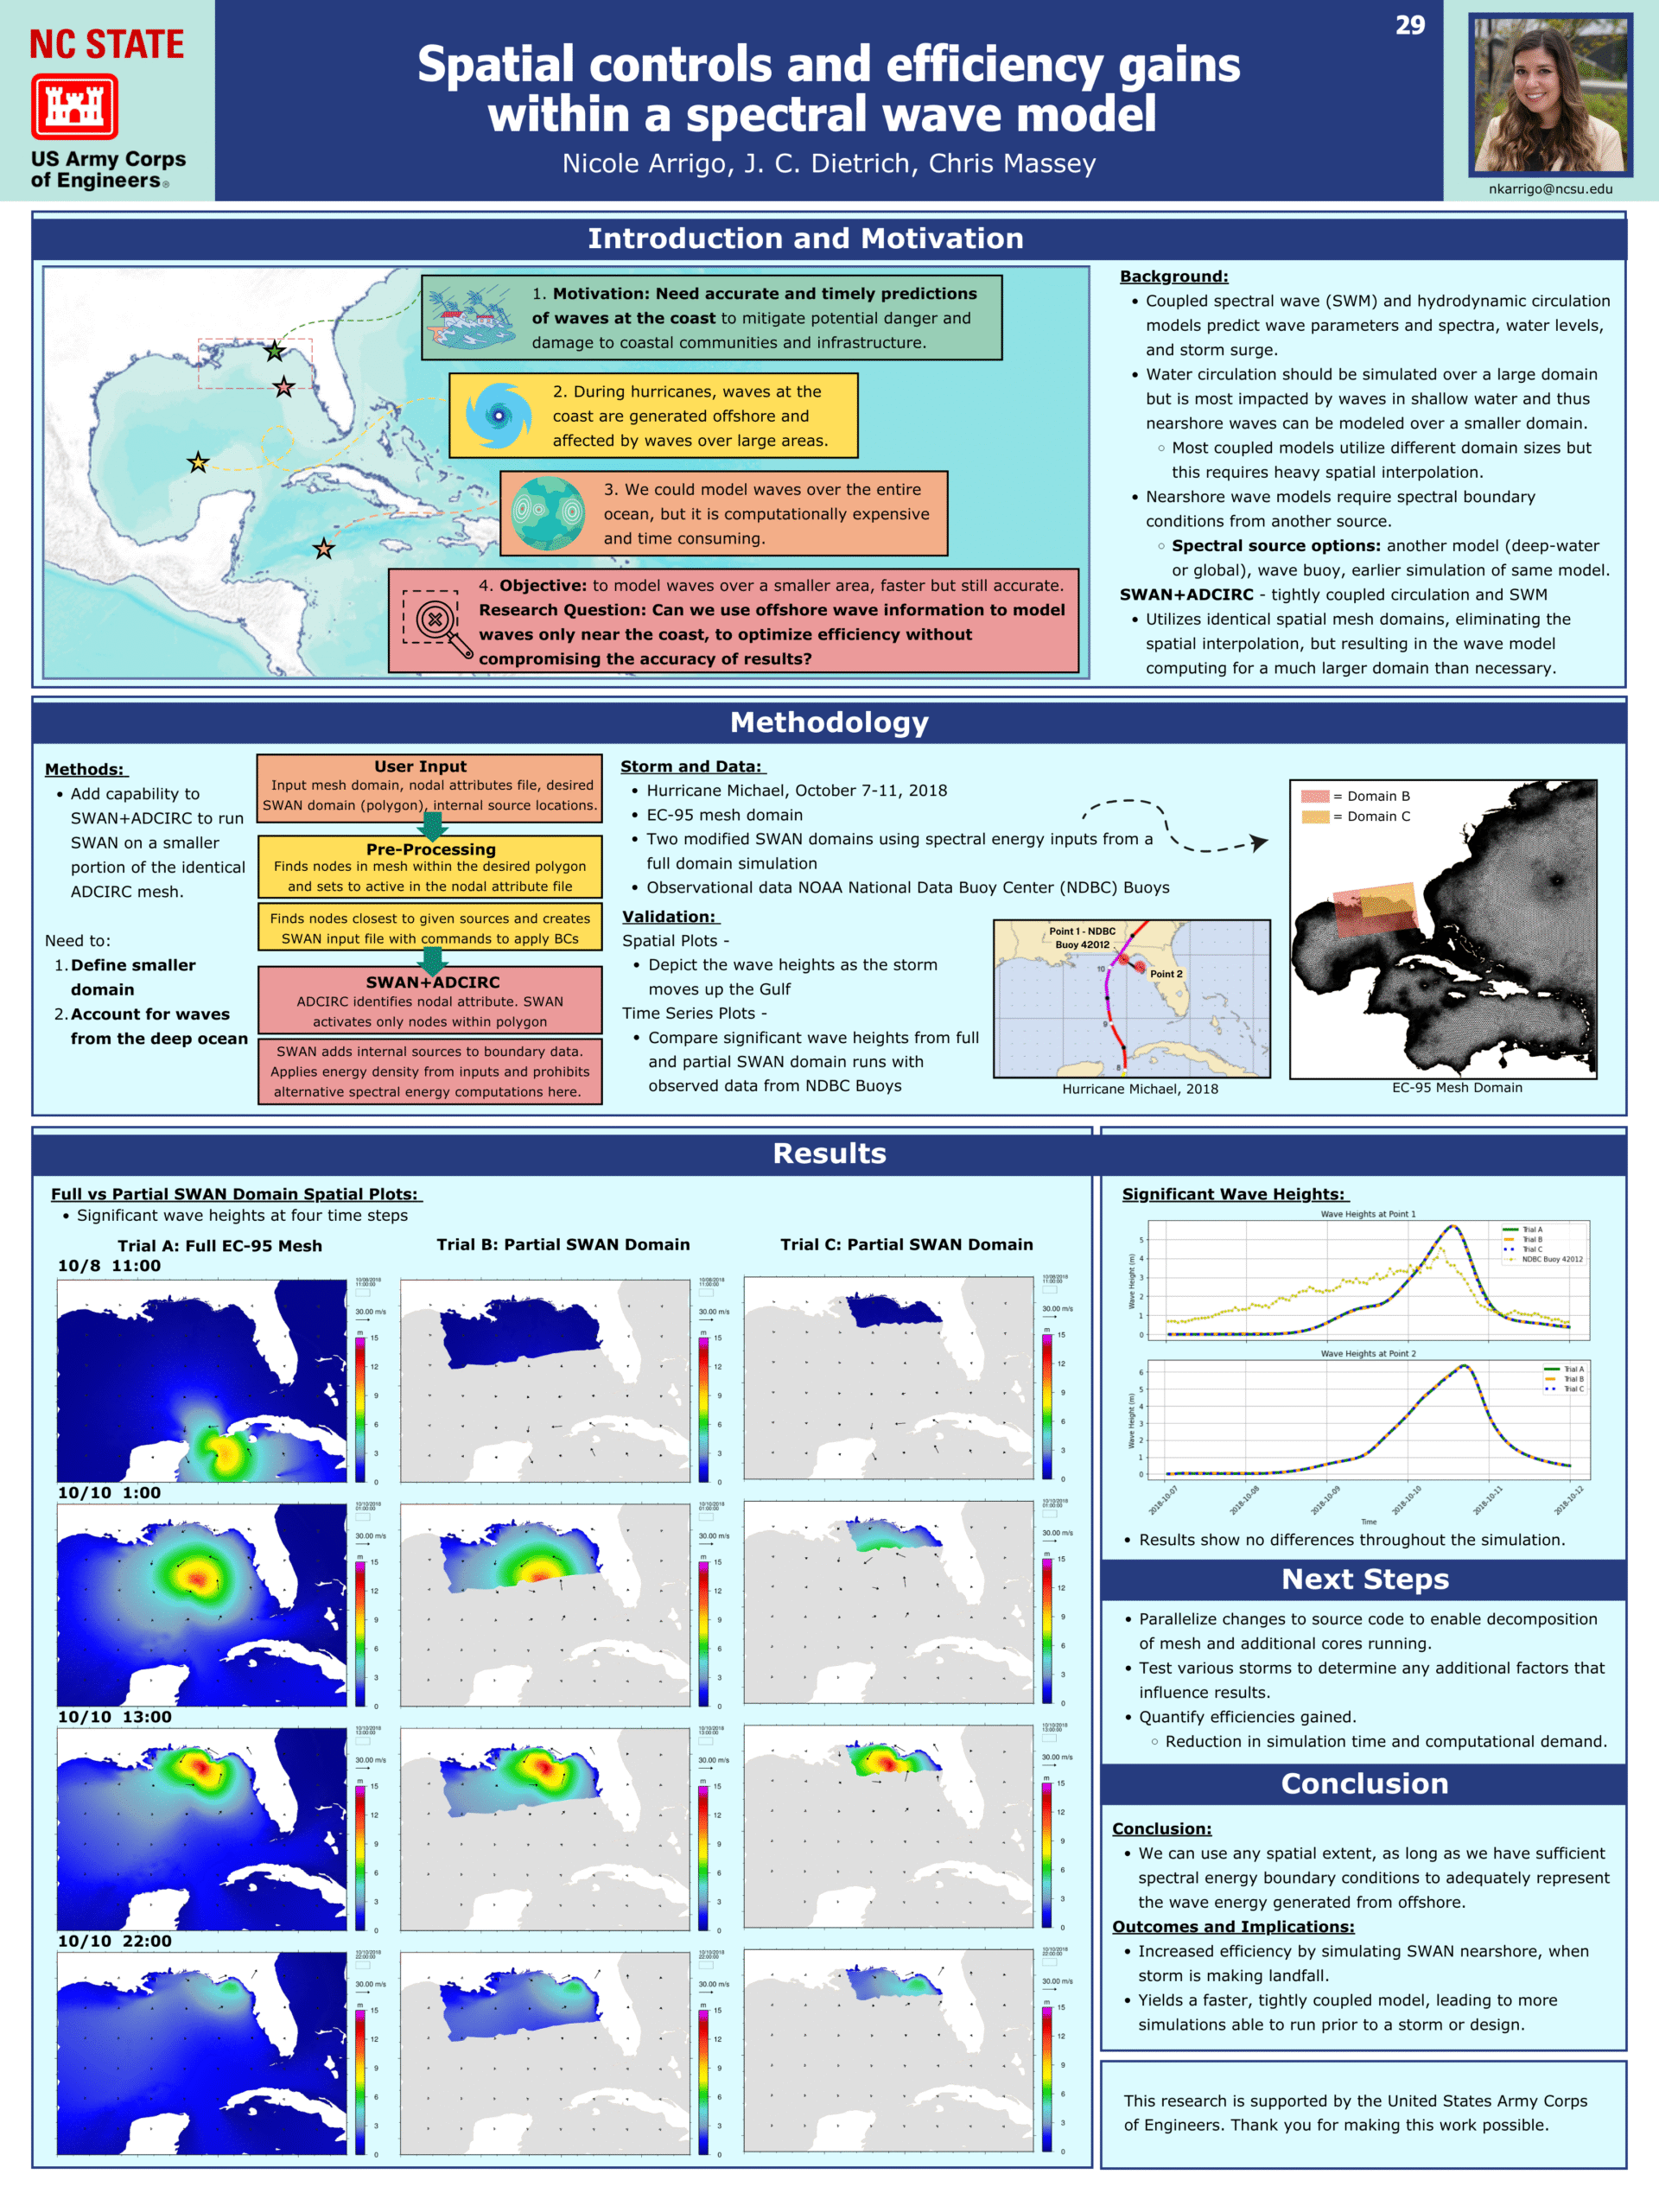
Spatial controls and efficiency gains within a spectral wave model.
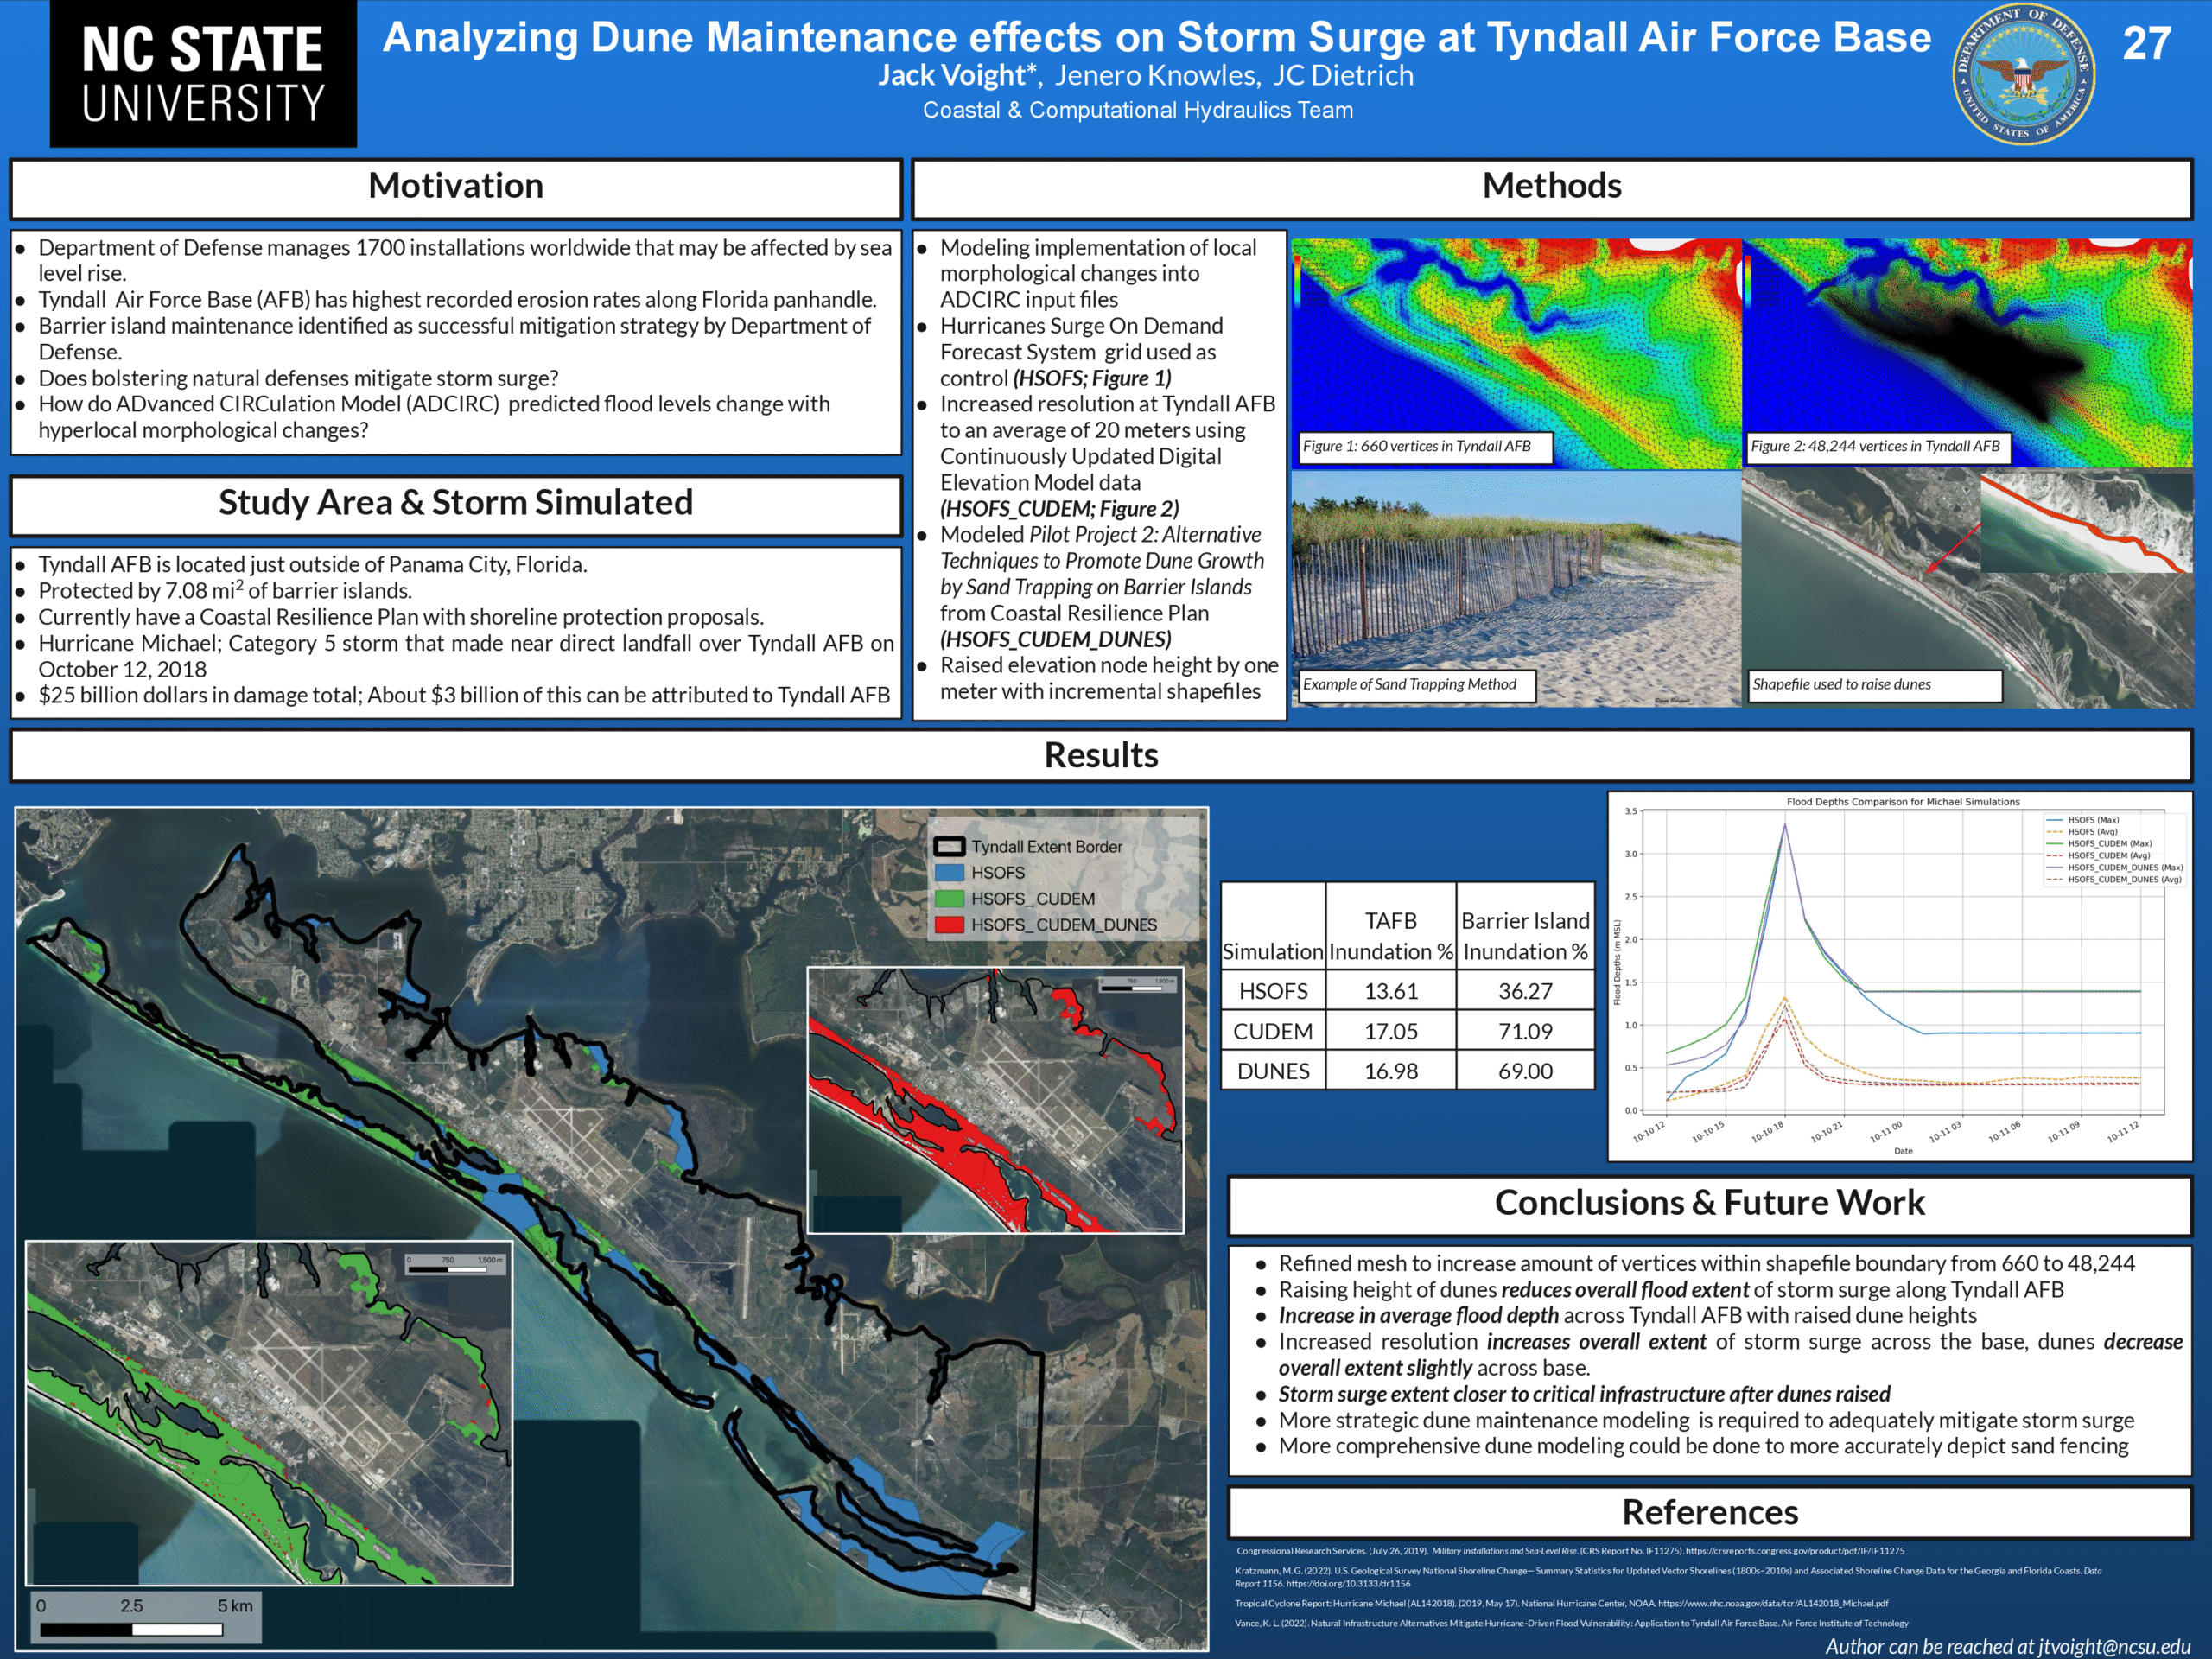
Analyzing Dune Maintenance effects on Storm Surge at Tyndall Air Force Base.
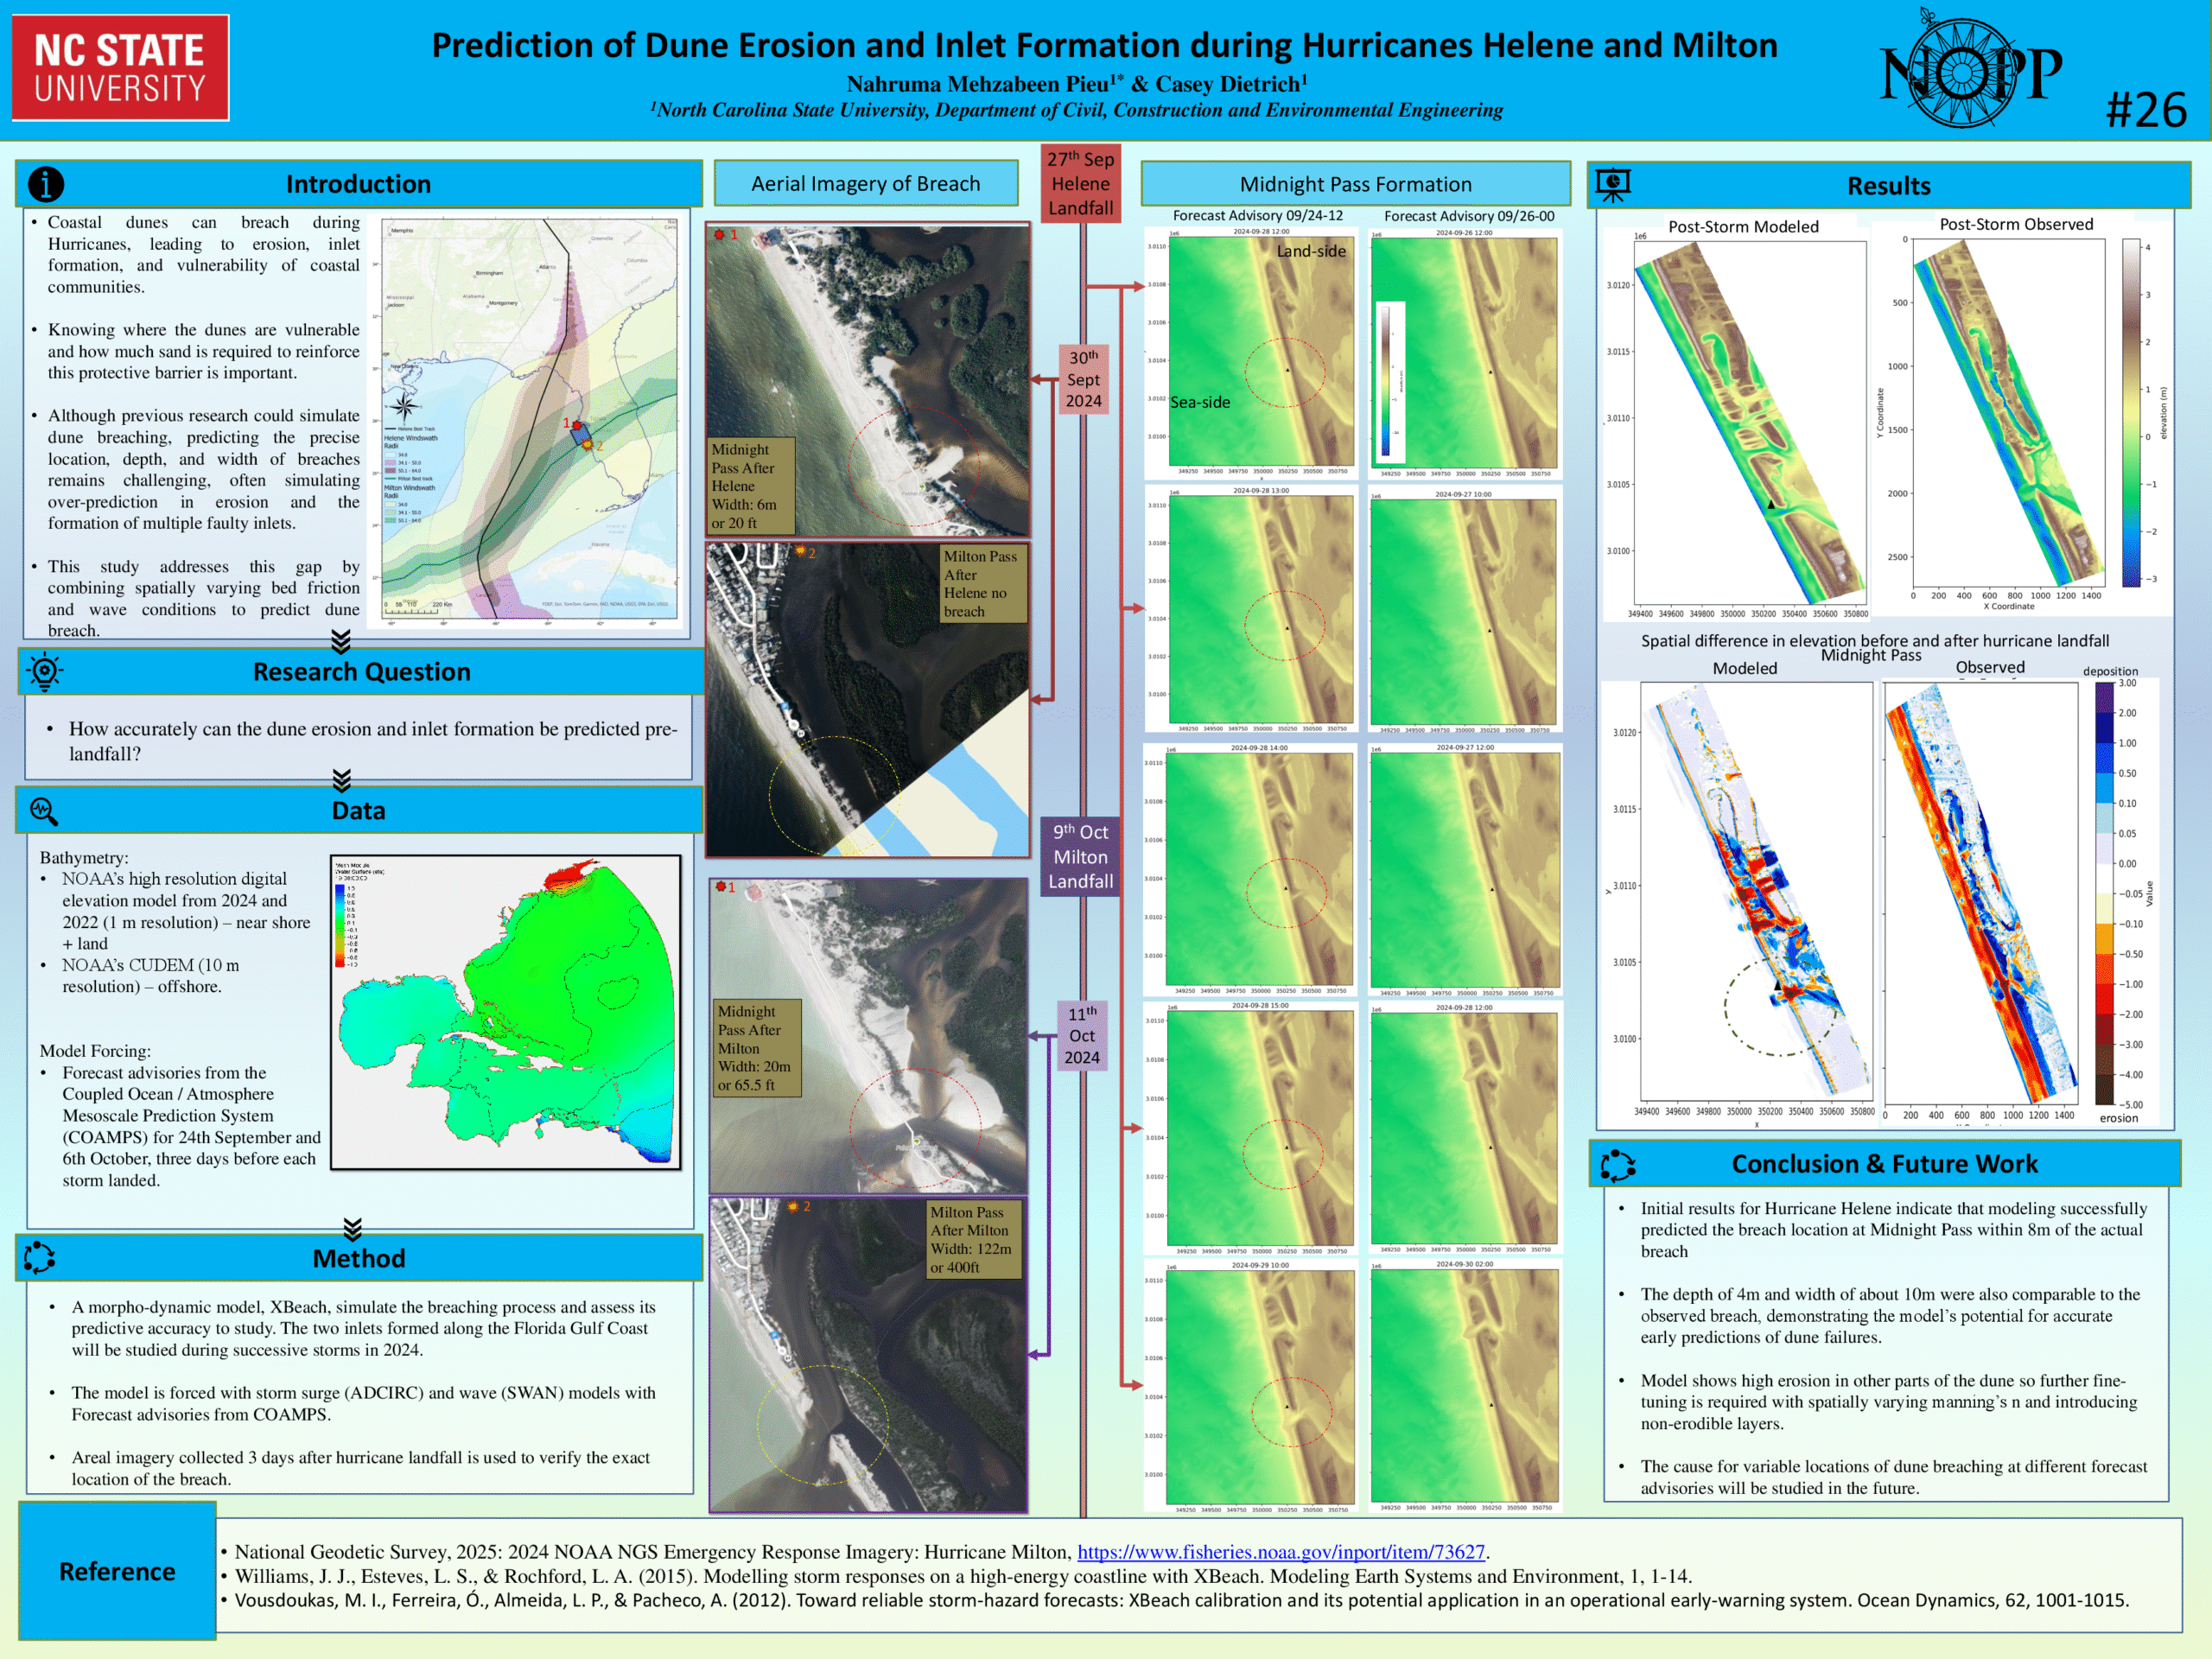
Prediction of Dune Erosion and Inlet Formation during Hurricanes Helene and Milton.
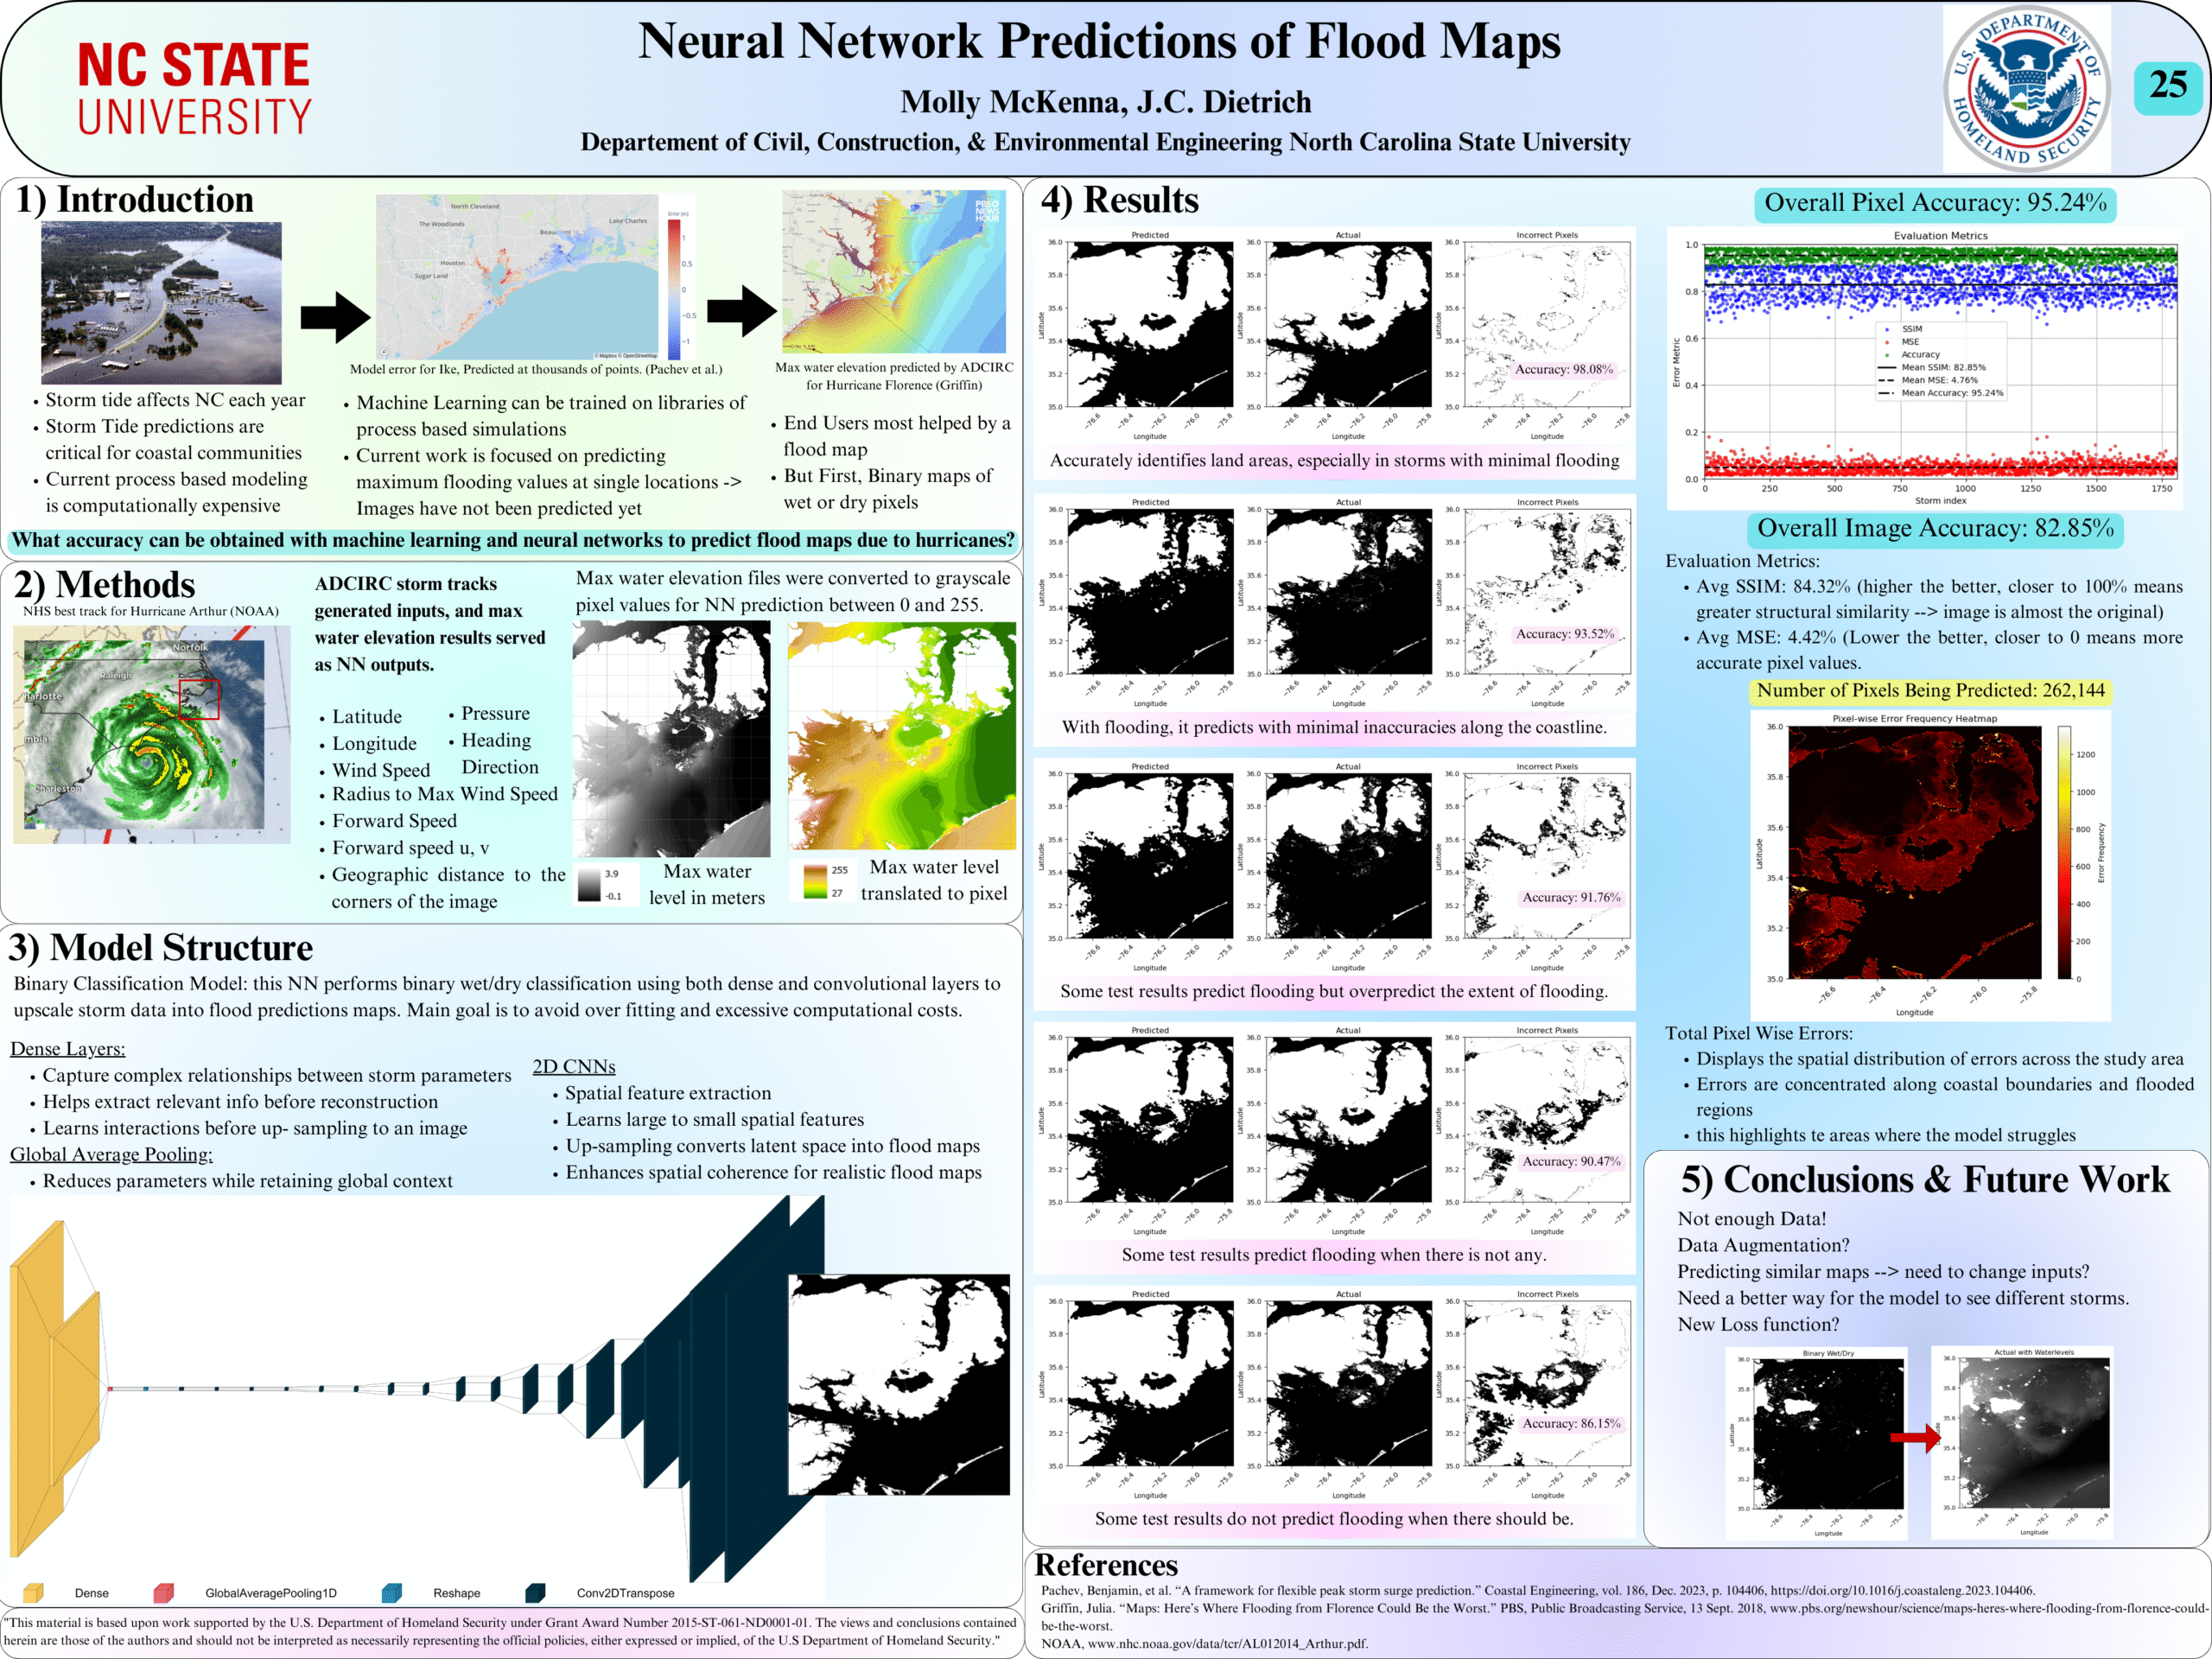
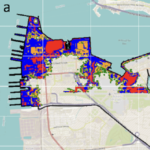
Neural Network Predictions of Flood Maps
Invited Seminar: Nagoya 2025
Sensitivity of Water Level and Flood Area Prediction to Hurricane Characteristics and Climate Change Impacts
 The combined impact of hurricanes and climate change can affect the total water level leading to severe impacts on coastal zones such as flooding. Accurate prediction and evaluation of water levels are essential for predicting the impact on military readiness and resilience for coastal facilities. This study uses D-Flow Flexible Mesh to evaluate the sensitivity of water level and flood area prediction to the impact of climate change and hurricane activity with application to the Naval Station Norfolk, Virginia, USA.
The water level (tide and surge) was simulated and the potential flooding resulting from historical hurricanes (Irene and Isabel) in Norfolk, VA was evaluated. The model was forced using the parametric Holland Model and various perturbations in the hurricane characteristics were evaluated. In addition, projected relative sea level rise up to the year 2150 was investigated.
D-Flow can accurately simulate the water level with an average correlation coefficient and root-mean-square-error of 0.974 and 0.17 m, respectively. Water level prediction showed high sensitivity to climate change impacts and inaccuracies in hurricane track and lower sensitivity to changes in hurricane central pressure and radius of maximum wind. A mesh resolution that reflects accurate topographical depiction is required to estimate the flood area accurately. Willoughby Spit (a narrow peninsula north of the naval base extending into Chesapeake Bay) was the most susceptible area to flooding. Significant parts of the base were found to be vulnerable to flooding under the considered scenarios, with flood areas ranging from 0.28 km2 to 5.94 km2 (1.3%–43% of the base area), with the largest predicted flooding for the sea level rise and wind speed scenarios. The insights of the sensitivity of flood predictions to various factors could enable targeted adaptation measures and resource allocation, for enhanced resilience and sustainable development in vulnerable coastal areas.
News: Erosion Forecast Framework
2025/01/22 – NCSU Civil, Construction, and Environmental Engineering
New technology forecasts beach and dune erosion before hurricanes strike
New technology forecasts beach and dune erosion before hurricanes strike

“Physics-based models can predict how the dune may be lowered, and how much water may flood behind it,” said Jess Gorski (MS 2023), who worked with Professor Casey Dietrich on the project. “Our forecasts can provide information about coastal change to decision makers during a storm.”
In collaboration with the USGS, CCEE researchers developed a framework for running the eXtreme Beach (XBeach) model in real time. The U.S. Gulf and Atlantic coasts are described with thousands of transects, which quantify the offshore depths and the shape of the beach and dune at intervals of 500 m to 2 km along the coast. When a storm approaches, the framework can select the transects that may be affected, and then run a few hundred simulations of the coastal erosion.
News: NC State on the Coast
2024/10/08 – NC State
NC State faculty and students are helping to keep coastal communities healthy through the North Carolina Center for Coastal Algae, People and Environment
NC State faculty and students are helping to keep coastal communities healthy through the North Carolina Center for Coastal Algae, People and Environment
NC C-CAPE (and our fearless leader Astrid Schnetzer) were featured on the NC State homepage.
NC C-CAPE was featured on the NC State homepage. Lots of information and quotes from folks in the center, including great photos of our colleagues in the field and laboratory. It is fun to contribute to such a large, meaningful research effort.
“In the past few months, we’ve officially started to sample as NC C-CAPE,” [Barrett] Rose said. “It was a shock to see the magnitude of how much we were actually studying. It went from a small pilot study to a huge center effort.”
Data collection and analysis is only the first part of the work NC C-CAPE seeks to do. While harmful algal blooms are common in fresh waters across the U.S. and the world, major data gaps around the issue exist. [Astrid] Schnetzer’s data will inform NC C-CAPE’s other two projects, which focus on predicting the health risks of toxic algal blooms on mammals and humans, as well as considering how factors like climate change will affect future toxin levels in water and seafood.
“The most exciting aspect of NC C-CAPE for me is that the research doesn’t end where my expertise ends,” said Schnetzer. “What we learn from the field about algal toxins is handed to the next team to look at the bigger picture on the ecosystem level and in connection to human health.”
Wind and Rain Compound with Tides to Cause Frequent and Unexpected Coastal Floods
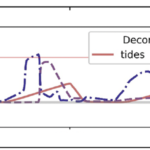 With sea-level rise, flooding in coastal communities is now common during the highest high tides. Floods also occur at normal tidal levels when rainfall overcomes stormwater infrastructure that is partially submerged by tides. Data describing this type of compound flooding is scarce and, therefore, it is unclear how often these floods occur and the extent to which non-tidal factors contribute to flooding. We combine measurements of flooding on roads and within storm drains with a numerical model to examine processes that contribute to flooding in Carolina Beach, NC, USA — a community that chronically floods outside of extreme storms despite flood mitigation infrastructure to combat tidal flooding. Of the 43 non-storm floods we measured during a year-long study period, one-third were unexpected based on the tidal threshold used by the community for flood monitoring. We introduce a novel model coupling between an ocean-scale hydrodynamic model (ADCIRC) and a community-scale surface water and pipe flow model (3Di) to quantify contributions from multiple flood drivers. Accounting for the compounding effects of tides, wind, and rain increases flood water levels by up to 0.4 m compared to simulations that include only tides. Setup from sustained (non-storm) regional winds causes deeper, longer, more extensive flooding during the highest high tides and can cause floods on days when flooding would not have occurred due to tides alone. Rainfall also contributes to unexpected floods; because tides submerge stormwater outfalls on a daily basis, even minor rainstorms lead to flooding as runoff has nowhere to drain. As a particularly low-lying coastal community, Carolina Beach provides a glimpse into future challenges that coastal communities worldwide will face in predicting, preparing for, and adapting to increasingly frequent flooding from compounding tidal and non-tidal drivers atop sea-level rise.
Creating DEMs for Kalpana
These instructions were developed by undergraduate researcher Hunter Hudson.
Kalpana can be used visualize and downscale ADCIRC predictions of storm surge and flooding, with documentation in a recent journal manuscript and examples in its GitHub repository. For downscaling, ADCIRC predictions can be mapped from the model resolution (e.g. 50 to 100 m or larger in coastal regions) to higher resolutions (e.g. 10 m or smaller in a DEM). The downscaled flood map is a better representation of the hazard.
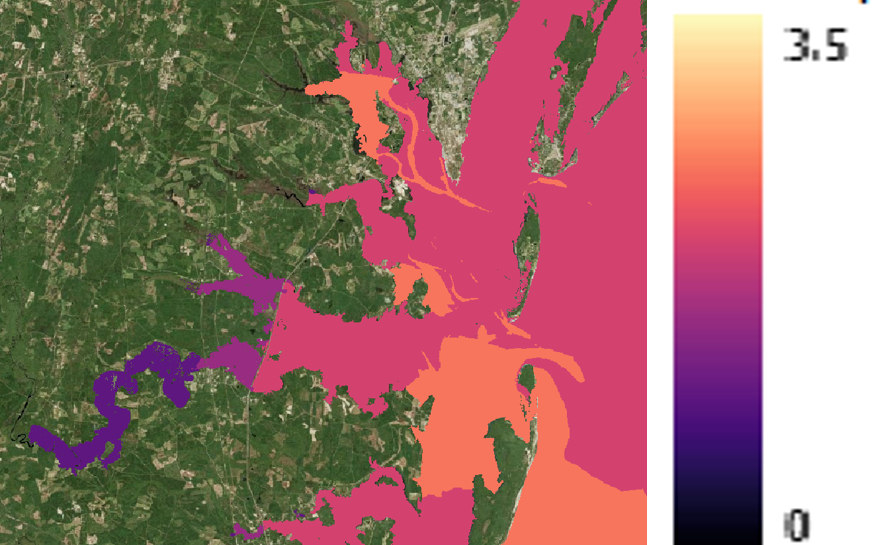
Maximum water levels along the Georgia coast due to Hurricane Matthew (2016) as visualized by Kalpana.
However, as an input for downscaling, Kalpana requires a raster DEM as a target. DEMs can be quite large, and thus it can be challenging to store and share them for other users. It is better for each user to develop their own DEM, with a specific focus to their region of interest and a specific resolution. On this page, we provide information about how to create DEMs for use with Kalpana.
Please continue reading for information on how to construct DEMs!