

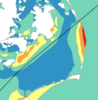
 The study begins with an application of a state-of-the-art storm surge model to examine the effects of meteorological forecast errors on coastal flooding predictions along the North Carolina (NC) coastline. As Hurricane Arthur (2014) moved over Pamlico Sound, it increased the total water levels to 2.5 m above sea level; this water pushed first into the river estuaries and against the inner banks, and then moved eastward to threaten the sound-side of the barrier islands. It is hypothesized that a combination of storm track and intensity errors caused errors in the forecast winds and water levels along the NC coast during Arthur. Model results reveal that, as the forecast storm track and intensity errors increase, the errors in forecast wind speeds also increase, but the errors in forecast water levels remain relatively the same, signifying the non-linear response of the coastal ocean to wind effects. By separating the forecast errors in storm track and storm strength, this study quantifies their effects on the coastal ocean, which provides useful guidance for designing relevant forecast ensembles.
 In addition to flooding impacts, storms can also cause dramatic changes in estuarine salinities, which can negatively impact estuarine ecosystems. Baroclinic models are useful tools for predicting estuarine salinity response under changing environmental conditions. In the present work, the features of wind- and plume-driven circulation in the vicinity of Choctawhatchee Bay (CB) and Destin Inlet, Florida, are analyzed with a recently-enhanced, three-dimensional, baroclinic model. Satellite imagery showed a visible brackish surface plume at Destin during low tide. The goal of the present study is to quantify variability in the plume signature due to changes in tidal and wind forcing. Modeled tides, salinities and plume signature are validated against in-situ observations and satellite imagery and then applied to analyze plume response in two scenarios. In the first case, model plume behavior is analyzed on successive days of near-constant tidal amplitudes and changing wind directions due to passing cold fronts. In the second case, plume response is investigated during consecutive days of neap-spring variability in the tides and near-constant wind speeds. Model results reveal a larger plume during spring tides and periods of weak wind forcing. Oshore winds enhance the north-south expansion of the plume, whereas onshore winds restrict the plume to the coastline.
 Finally, the validated model is applied to identify salinity and transport characteristics within CB. Based on past studies, it is hypothesized that CB is a stratified system with limited flushing and zones of distinct salinity gradients. These hypotheses are tested by analyzing bay salinities from the validated model during a period of low river flows. Model surface salinities indicate brackish conditions (20 psu) throughout the bay except for near the river mouth. Stratification (10 to 15 psu) within the bay is unaffected by the passage of cold fronts and neap-spring tidal variability. The residence time within the Choctawhatchee Bay, an important indicator of estuarine health, is computed via particle tracking and is equal to roughly 40 days.
This work advances the scientific understanding of multiple aspects of estuarine circulation including wind-driven surge and flooding, brackish plume behavior through inlets and onto the shelf, and salinity transport and stratication properties within estuaries. Research ndings lead to a better understanding of estuarine response under a wide range of atmospheric conditions, and the resulting technologies will be useful for oil spill response operations, fisheries and pollution management.
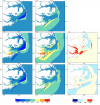 Storm surge prediction models rely on an accurate representation of the wind conditions. In this paper, we examine the sensitivity of surge predictions to forecast uncertainties in the track and strength of a storm (storm strength is quantified by the power dissipation of the associated wind field). This analysis is performed using Hurricane Arthur (2014), a Category 2 hurricane, which made landfall along the North Carolina (NC) coast in early July 2014. Hindcast simulations of a coupled hydrodynamic-wave model are performed on a large unstructured mesh to analyze the surge impact of Arthur along the NC coastline. The effects of Arthur are best represented by a post-storm data assimilated wind product with parametric vortex winds providing a close approximation. Surge predictions driven by forecast advisories issued by the National Hurricane Center (NHC) during Arthur are analyzed. The storm track predictions from the NHC improve over time. However, successive advisories predict an unrealistic increase in the storm’s strength. Due to these forecast errors, the global root mean square errors of the predicted wind speeds and water levels increase as the storm approaches landfall. The relative impacts of the track and strength errors on the surge predictions are assessed by replacing forecast storm parameters with the best known post-storm information about Arthur. In a “constant track” analysis, Arthur’s post storm determined track is used in place of the track predictions of the different advisories but each advisory retains its size and intensity predictions. In a “constant storm strength” analysis, forecast wind and pressure parameters are replaced by corresponding parameters extracted from the post storm analysis while each advisory retains its forecast storm track. We observe a strong correlation between the forecast errors and the wind speed predictions. However, the correlation between these errors and the forecast water levels is weak signifying a non-linear response of the shallow coastal waters to meteorological forcing.
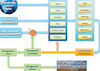
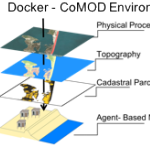 Tackling critical questions often requires the collaboration of researchers from different disciplines or institutions. Coastal hazards research is necessarily interdisciplinary and multi- methodological and often requires a team of researchers, due to its combination of storm-induced changes to the coastal environment, the effects of these changes on built infrastructure, and the combined effects on decision-making for individuals and communities. This paper introduces an interdisciplinary coastal hazard risk model that combines high resolution geospatial data, storm impact forecasts, and an agent-based model in the analysis, and then describes the model’s implementation in a data science cyberinfrastructure. Lessons learned and limitations are also outlined.
 Storm surge and overland flooding can be predicted with computational models at high levels of resolution. To improve efficiency in forecasting applications, surge models often use atmospheric forcing from parametric vortex models, which represent the surface pressures and wind fields with a few storm parameters. The future of storm surge prediction could involve real-time coupling of surge and full-physics atmospheric models; thus, their accuracies must be understood in a real hurricane scenario. The authors compare predictions from a parametric vortex model (using forecast tracks from the National Hurricane Center) and a full-physics coupled atmosphere-wave-ocean model during Hurricane Isaac (2012). The predictions are then applied within a tightly coupled, wave and surge modeling system describing the northern Gulf of Mexico and the floodplains of southwest Louisiana. It is shown that, in a hindcast scenario, a parametric vortex model can outperform a data-assimilated wind product, and given reasonable forecast advisories, a parametric vortex model gives reasonable surge forecasts. However, forecasts using a full-physics coupled model outperformed the forecast advisories and improved surge forecasts. Both approaches are valuable for forecasting the coastal impacts associated with tropical cyclones
 Hurricane Sandy devastated the Northeast US coastline in 2012. In New York City, it caused power outages that affected nearly 2 million people, forced evacuations of 6500 patients from hospitals and nursing homes, prevented 1.1 million children from attending school for a week, and disrupted the daily travel of about 11 million commuters. Many of these impacts were related to flooding of critical infrastructure, including nearly 90,000 buildings, and more than $5 billion in damages in the mass transit system. The maximum observed water level at the tidal gauge located at the southern tip of Manhattan was 5.3 m above the station datum and 2.8 m above the expected tide. This additional water, known as storm surge, was pushed from the open sea by strong winds during the storm. Sandy was one of several recent storms to cause flooding along the US Gulf and Atlantic coasts, including Katrina and Rita (2005), Gustav and Ike (2008), Irene (2011), Isaac (2012), and Hermine and Matthew (2016). Climatic changes are causing these storms to be larger and more intense, last longer, and move farther northward. Their impacts will be more severe to communities in coastal regions in the future.
 Rising sea level represents a significant threat to coastal communities and ecosystems, including altered habitats and increased vulnerability to coastal storms and recurrent inundation. This threat is exemplified in the northern Gulf of Mexico, where low topography, marshes, and a prevalence of tropical storms have resulted in extensive coastal impacts. The ability to facilitate adaptation and mitigation measures relies, in part, on the development of robust predictive capabilities that incorporate complex biological processes with physical dynamics. Initiated in 2010, the 6-year Ecological Effects of Sea Level Rise—Northern Gulf of Mexico project applied a transdisciplinary science approach to develop a suite of integrated modeling platforms informed by empirical data that are capable of evaluating a range of climate change scenarios. This special issue highlights resultant integrated models focused on tidal hydrodynamics, shoreline morphology, oyster ecology, coastal wetland vulnerability, and storm surges that demonstrate the need for dynamic models to incorporate feedbacks among physical and biological processes in assessments of sea level rise effects on coastal systems. Effects are projected to be significant, spatially variable and nonlinear relative to sea level rise rates. Scenarios of higher sea level rise rates are projected to exceed thresholds of wetland sustainability, and many regions will experience enhanced storm surges. Influenced by an extensive collaborative stakeholder engagement process, these assessments on the coastal dynamics of sea level rise provide a strong foundation for resilience measures in the northern Gulf of Mexico and a transferable approach for application to other coastal regions throughout the world.
 The SWAN+ADCIRC shallow-water circulation model, validated for Hurricane Ike (2008), was used to develop five synthetic storm surge scenarios for the upper Texas coast in which wind speed was increased and landfall location was shifted 40 km westward. The Hurricane Ike simulation and the synthetic storms were used to study the maximum water elevations in Galveston Bay, as well as the timing and behavior of surge relative to the hurricane track. Sixteen locations indicative of surge behavior in and around Galveston Bay were chosen for analysis in this paper. Results show that water surface elevations present in Galveston Bay are dominated by the counterclockwise hurricane winds and that increasing wind speeds by 15% results in approximately 23% (+/−3%) higher surge. Furthermore, shifting the storm westward causes higher levels of surge in the more populated areas due to more intense, higher shore-normal winds. This research helps to highlight the vulnerability of the upper Texas Gulf Coast to hurricane storm surge and lends insight to storm surge and flood mitigation studies in the Houston–Galveston region.