

These analyses were performed by Carter Day, an undergraduate researcher in our team.
Like other spectral wave models, SWAN uses parameterizations to represent sources (e.g. wind), sinks (e.g. whitecapping, bottom friction, depth-limited breaking), and resonance (e.g. quadruplet and triad wave-wave interactions). Each parameterization is based on laboratory and experimental data to represent the transfer of energy to, from, and between waves. It is necessary for each term to represent its physical process, but it is also necessary for the terms to be calibrated collectively to represent their combined effects on wave evolution.
SWAN release version 41.31 was modified in two main ways: derivative computation was changed to use the Green-Gauss formula, and a new ‘package’ of wave physics (the so-called ST6 physics) was introduced. This package includes new parameterizations of wind input, whitecapping, swell dissipation, wind speed scaling, and other processes. The ST6 physics have been adopted by other wave models (e.g. NOAA’s WaveWatch III), and it will likely become the preferred physics package for SWAN. However, because the ST6 physics package has changes to so many parameterizations, it is necessary to quantify its effects on wave predictions during recent storms.
In this study, we simulate two recent hurricanes, Gustav (2008) and Florence (2018), and we compare wave predictions with the new ST6 physics package. Do the ST6 physics improve the SWAN wave predictions?
SWAN Settings
For each storm (Gustav and Florence), we examined the performance of the new ST6 physics in two ways. First, we compared the SWAN predictions using the ST6 physics with similar predictions using the ‘default’ physics in two recent SWAN release versions. These three simulations are summarized in the following table.
| Version-Physics | Input Command(s) |
|---|---|
| v41.10-Default | GEN3 KOMEN AGROW |
| v41.31-Default | GEN3 KOMEN AGROW |
| v41.31-ST6 | GEN3 ST6 4.70E-7 6.6E-6 4 4 UP HWANG VECTAU U10PROXY 28 AGROWSSWELL ARDHUIN 1.2 |
Second, we compared the SWAN predictions using different settings for the ST6 physics. The SWAN User Manual describes several alternative settings, which are based on recent studies and which can be selected via commands in the SWAN input file. These alternative settings are summarized in the following table.
| Version-Physics | Input Command(s) |
|---|---|
| v41.31-ST6 | GEN3 ST6 4.70E-7 6.6E-6 4 4 UP HWANG VECTAU U10PROXY 28 AGROWSSWELL ARDHUIN 1.2 |
| v41.31-ST6-FAN | GEN3 ST6 4.70E-7 6.6E-6 4 4 UP FAN VECTAU U10PROXY 28 AGROWSSWELL ARDHUIN 1.2 |
| v41.31-ST6-HWANG32 | GEN3 ST6 2.8E-6 3.5E-5 4 4 UP HWANG VECTAU U10PROXY 32 AGROWSSWELL ARDHUIN 1.2 |
| v41.31-ST6-HWANG35 | GEN3 ST6 6.50E-6 8.50E-5 4 4 UP HWANG VECTAU U10PROXY 35 AGROWSSWELL ARDHUIN 1.2 |
For each storm and SWAN simulation, we quantify performance via comparisons to observations of significant wave heights, as collected by the National Data Buoy Center (NDBC). For each observation location, performance is quantified via root-mean-square errors ( ):
):

in which  are the predicted significant wave heights at that buoy location in a model simulation,
  are the observed significant wave heights as observed at a buoy location by the NDBC, and
  is the total number of values in the time series. Values of closer to zero indicate predicted values that were closer to the observed values, meaning more accurate simulation results.
We focus specifically on predictions of significant wave heights in the following analyses. Analyses of other wave parameters are left for future work.
Gustav (2008)
Gustav formed on 25 August 2008 and strengthened rapidly as it moved across the Gulf of Mexico. The storm created waves with significant heights as large as 12 m as observed at NDBC buoys, and it pushed storm surge into southeast Louisiana, causing the total water levels to be as large as 4 m at nearshore gauges. Gustav made landfall on 1 September 2008 as a Category-2 hurricane, resulting in significant damages as well as 7 casualties. The following graphic shows Gustav’s track.
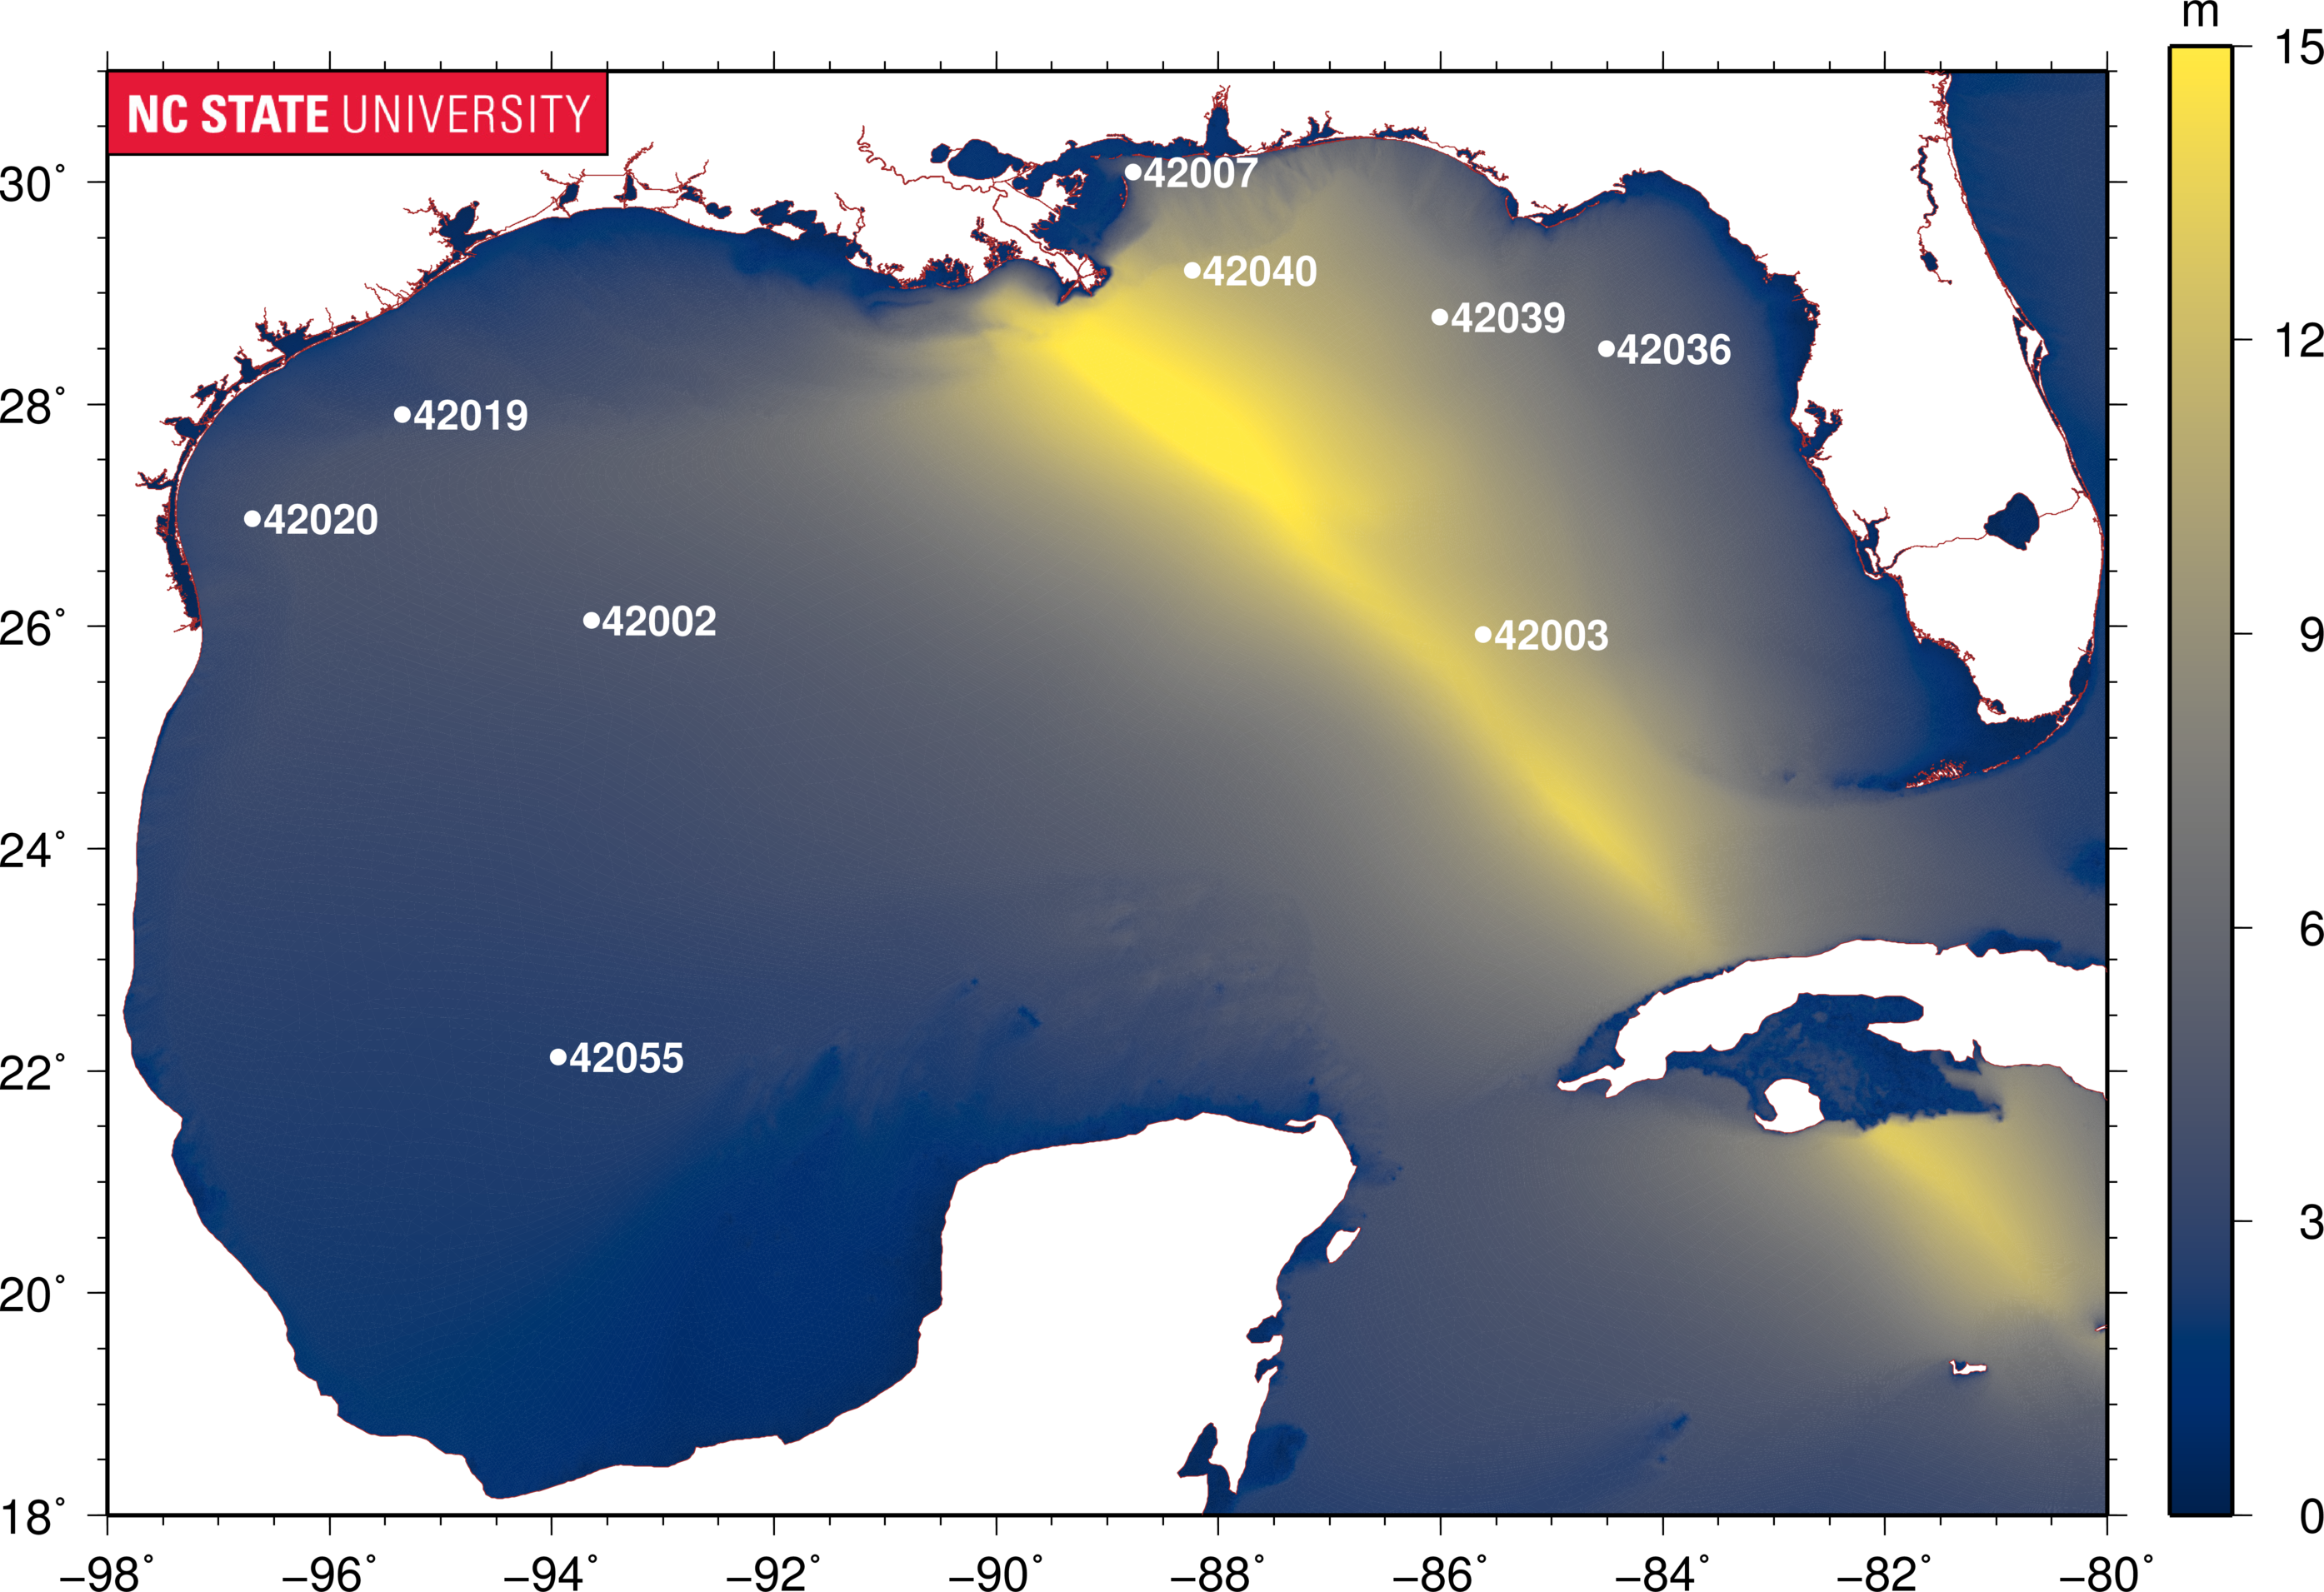
For Gustav (2008), contours of maximum significant wave heights (m) as computed by SWAN v41.10, and locations of NDBC buoys.
Gustav was selected to test the new physics package because the storm’s effects on the wave environment were well-documented in the Gulf of Mexico. Observations of significant wave heights were recorded for buoys near the storm track. Nine buoys were selected for this analysis based on location relative to the storm track and availability of data for the duration of the storm. The observations at these buoys were used as a basis with which we could compare our simulation results to determine accuracy.
Three versions of the simulation were run: v41.10-Default, v41.31-Default, and v41.31-ST6. We evaluated the three different simulations using two main methods: and time series plots.
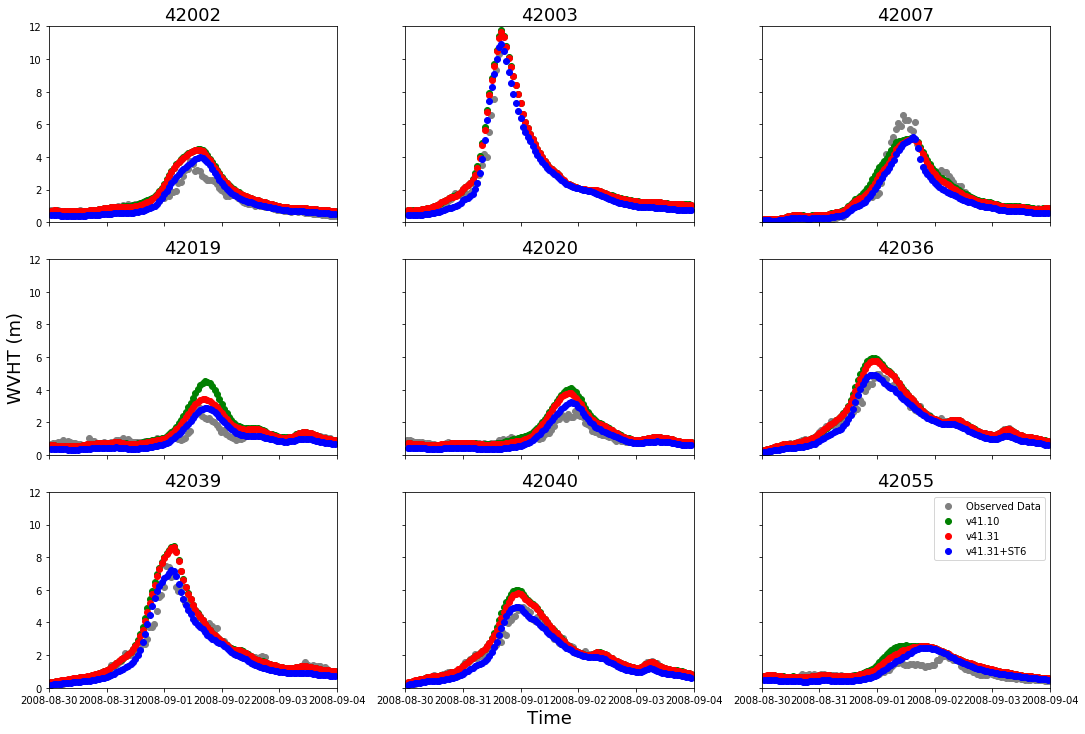
For Gustav (2008), time series of significant wave heights at nine NDBC buoys.
In most cases, we observed small differences in the significant wave heights between the three simulations. The v41.10-Default and v41.31-Default results are very similar at almost all stations. However, in some cases (i.e. buoys 42019, 42036, and 42039), the predicted wave heights were more accurate for the v41.31-ST6 simulation. At these three buoy locations, the v41.10-Default results had peaks that were too high relative to the observations, including a peak of 5 m at buoy 42019. However, the v41.31-ST6 results were a better match to the peak significant wave heights including 3 m at buoy 42019. These improved predictions at the storm peak then translate into better predictions overall.
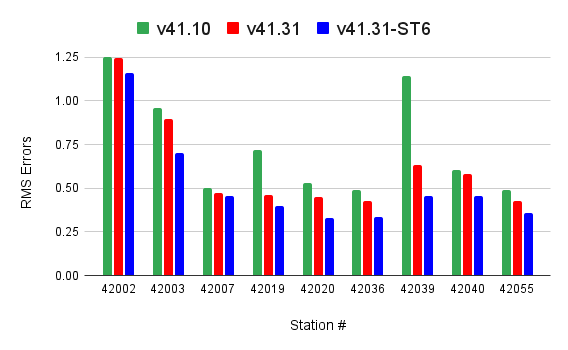
For Gustav (2008), root-mean-square errors for predictions of significant wave heights at nine NDBC buoys, with comparisons for SWAN versions and physics package.
The graph above shows root-mean-square errors for v41.10-Default, v41.31-Default, and v41.31-ST6. For all nine observation locations, v41.31-ST6 produced the lowest , meaning that the wave heights produced by this simulation were the most accurate.
From both the time series plots and the , we can conclude that the v41.31-ST6 physics formulation produced more accurate results than the ‘Default’ physics formulation for this storm. To better understand the performance of the new physics formulation package, we identified alternative settings that can be used with the ST6 physics (see the second table above), and then four simulations were run with these alternative settings. Root-mean-square errors were then calculated to determine which setting produced the most accurate results.
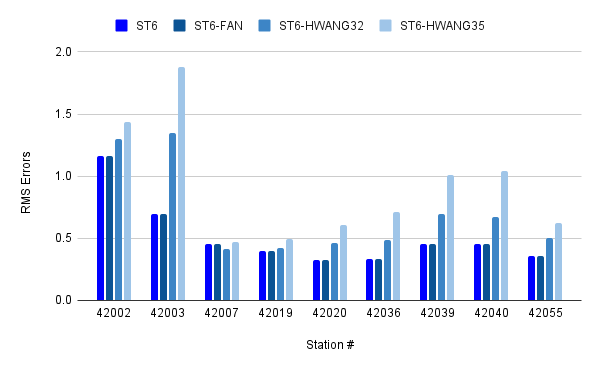
For Gustav (2008), root-mean-square errors for predictions of significant wave heights at nine NDBC buoys, with comparisons for alternative settings for the ST6 physics.
The v41.31-ST6 results are the best among the alternative settings, with smaller as compared to alternatives with FAN or HWANG settings. Due to this, we recommend SWAN users choose the base ST6 setting.
Florence (2018)
Florence originated from a strong tropical wave that emerged off the west coast of Africa on 30 August 2018. Florence made landfall early on 14 September just south of Wrightsville Beach, North Carolina as a Category 1 hurricane. Due to Florence, the Carolinas received record-breaking rainfall causing $24.23 billion in damage and 54 deaths. The following graphic shows Florence’s track.
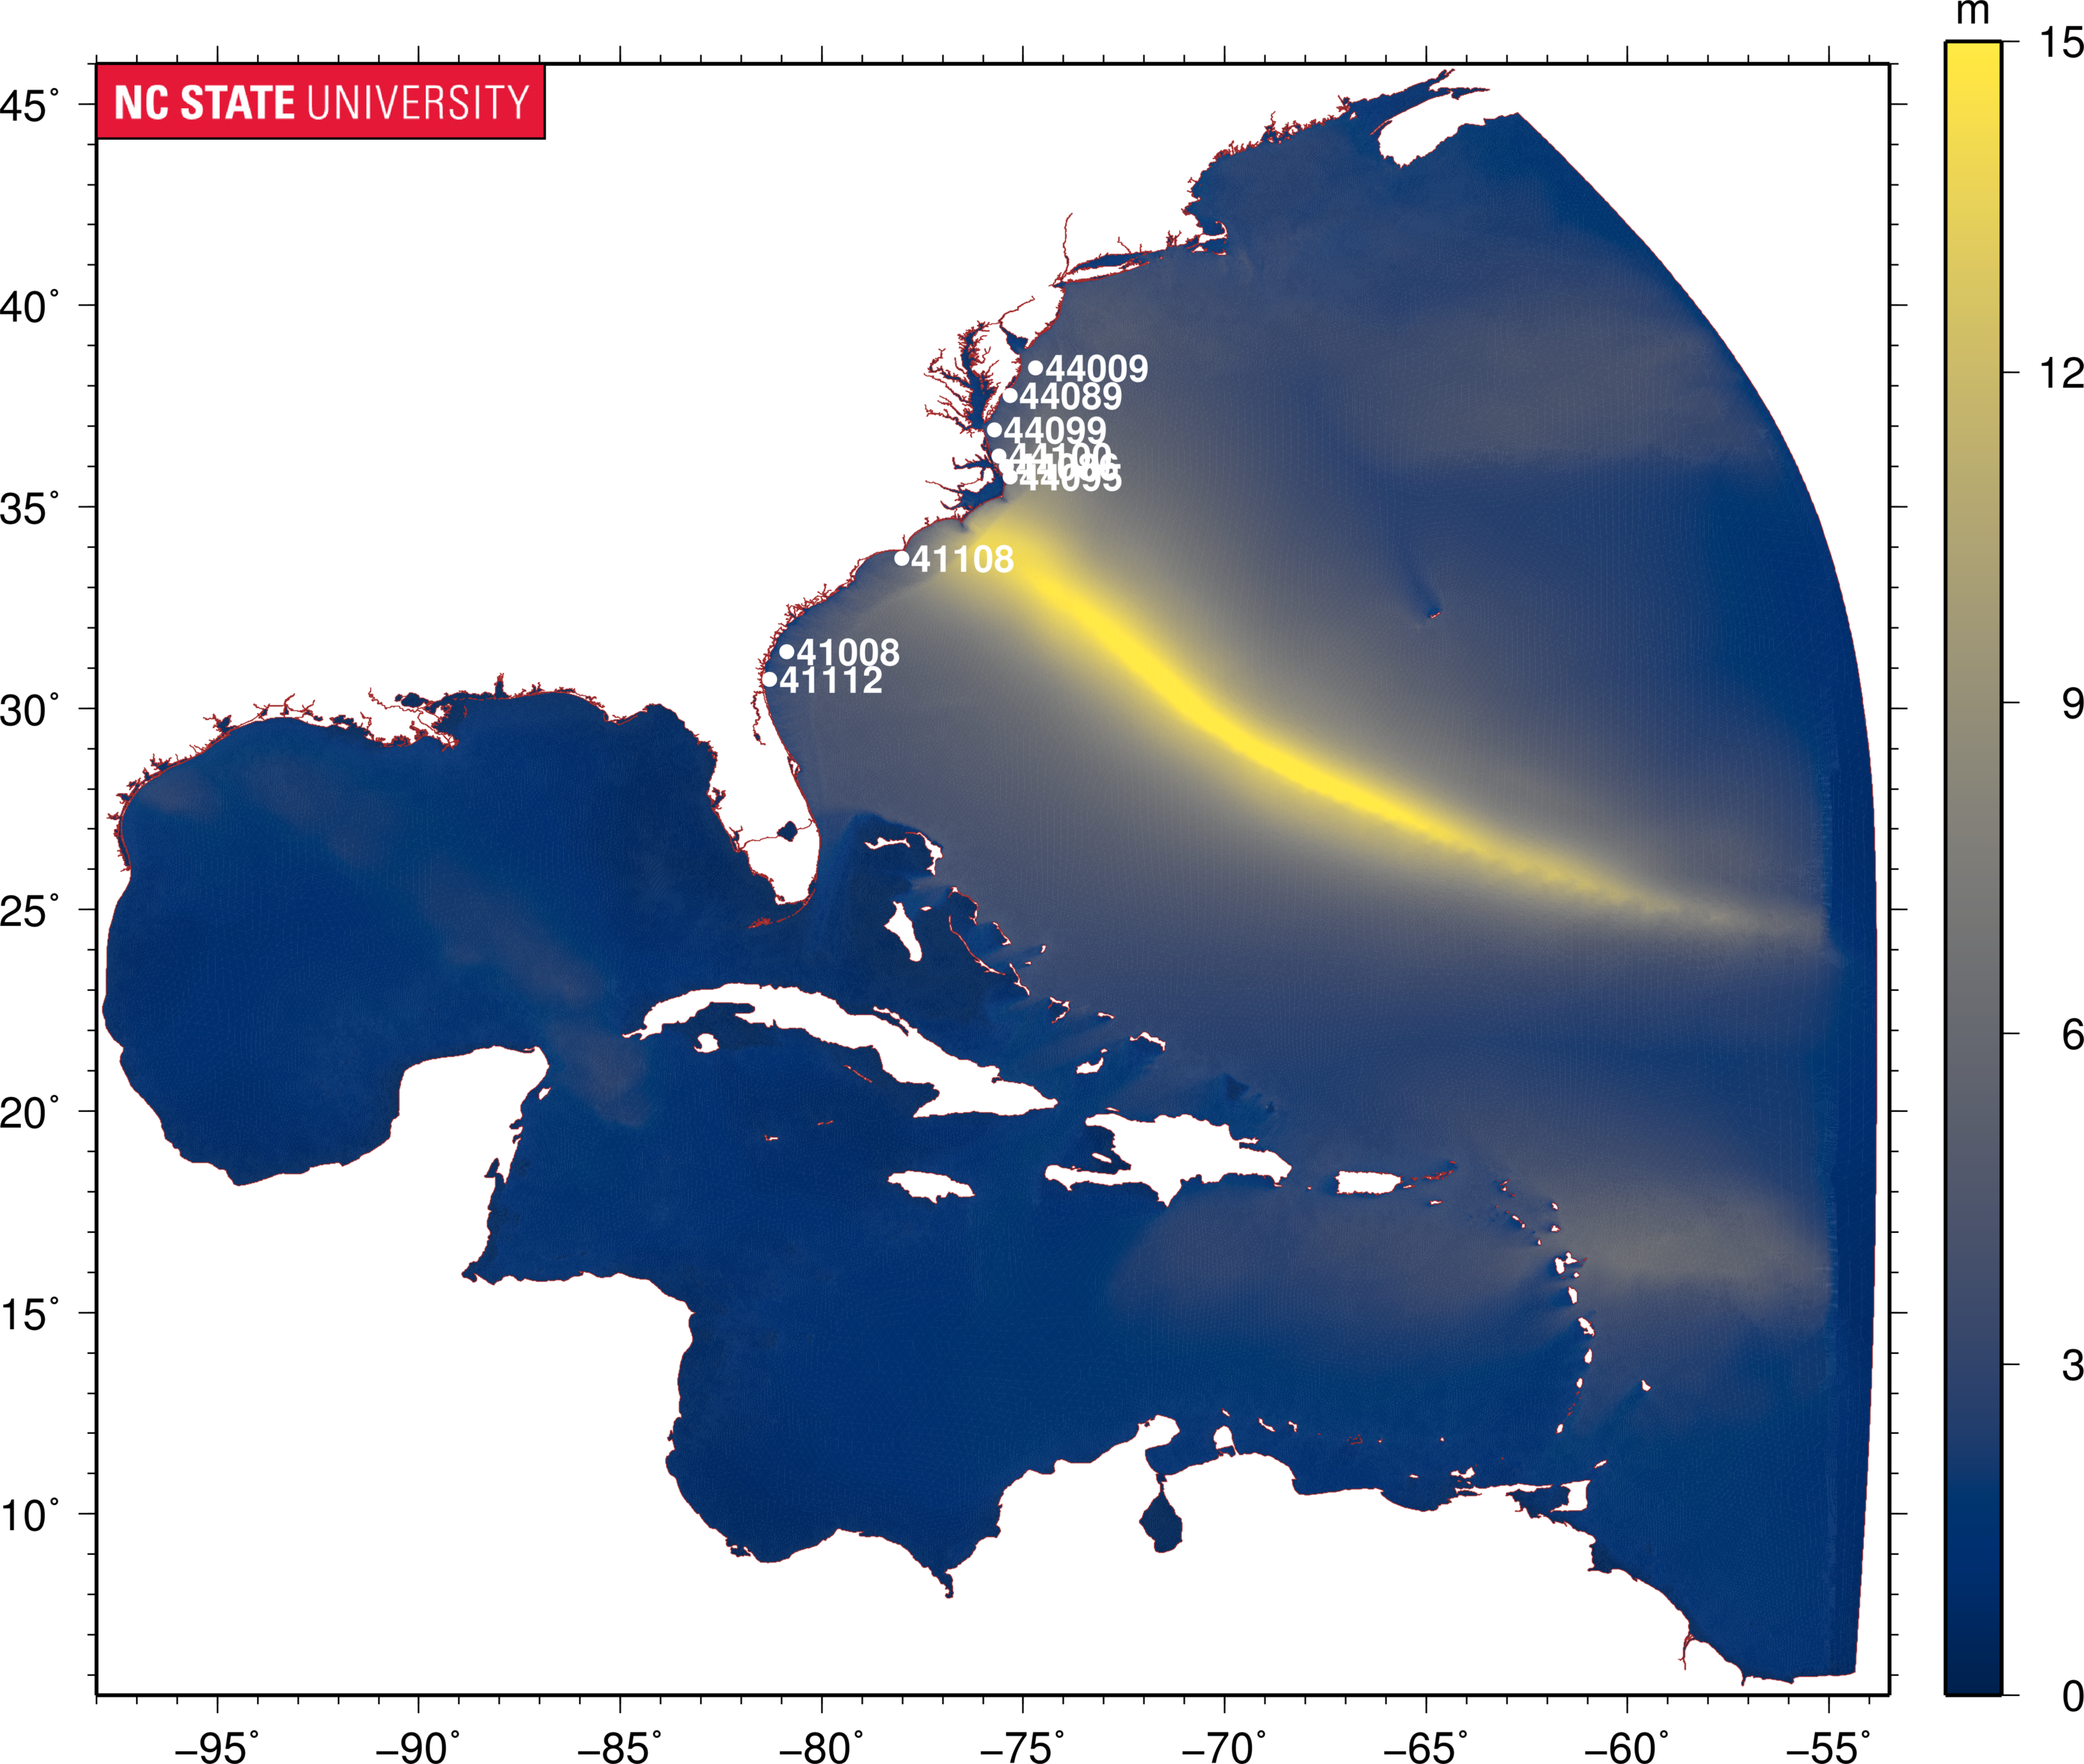
For Florence (2018), contours of maximum significant wave heights (m) as computed by SWAN v41.10, and locations of NDBC buoys.
In addition to Gustav, Florence was chosen to test the new physics package because of the storm’s location, time frame, and its significant impact. It was important consider a storm that varied significantly from Gustav in location to better understand the impact of the simulation on different locations along the coast. Buoys for the storm were chosen using a similar method to Gustav. Each buoy was chosen based on location relative to the storm track and the availability of data for the duration of the storm. The data collected at these buoys were used to compare our simulation results to determine accuracy.
The same three versions of the simulation were run: v41.10-Default, v41.31-Default, and v41.31-ST6. We evaluated the three different simulations using and time series plots.
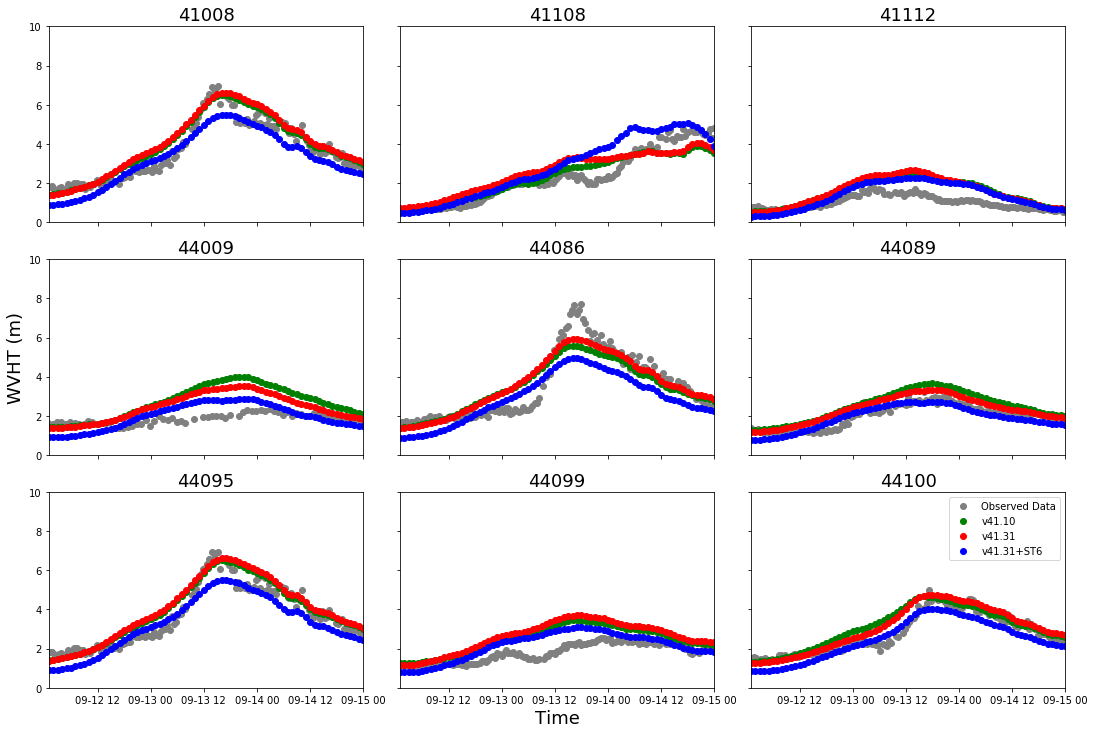
For Florence (2018), time series of significant wave heights at nine NDBC buoys.
The v41.10-Default and v41.31-Default results are very similar at almost all stations. In some cases, we observe that v41.10-Default and v41.31-Default can significantly overestimate the peak wave height (i.e. buoys 44009, 44089, 44099, and 4112). On the other hand, evaluating v41.31+ST6, we see that in some cases this version can underestimate the peak wave height (i.e. buoys 44086 and 44095). In order to further quantify these differences to evaluate accuracy, we calculated .
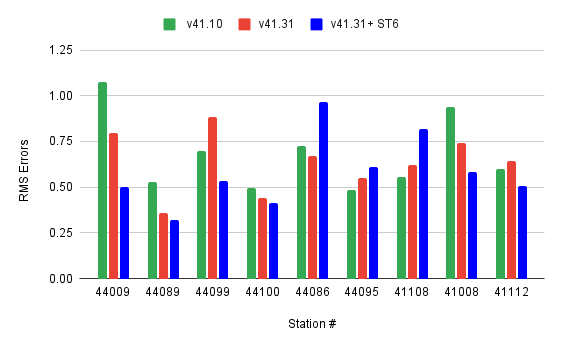
For Florence (2018), root-mean-square errors for predictions of significant wave heights at nine NDBC buoys, with comparisons for SWAN versions and physics package.
The graph above shows root-mean-square errors for v41.10-Default, v41.31-Default, and v41.31-ST6. As predicted, we do observe a higher for v41.10-ST6 at the stations where we saw underestimation of the peak wave height (i.e. buoys 44086 and 41108). However, for six out of the nine stations, we observe a lower root-mean-square error for v41.10-ST6 compared to both v41.10-Default and v41.31-Default.
From both the time series plots and the root-mean-square errors, we can conclude that the v41.31-ST6 physics formulation produced more accurate results than the ‘Default’ physics formulation for this storm. The four simulations of ST6 with the alternative settings were run and RMSE were then calculated to determine which setting produced the most accurate results.
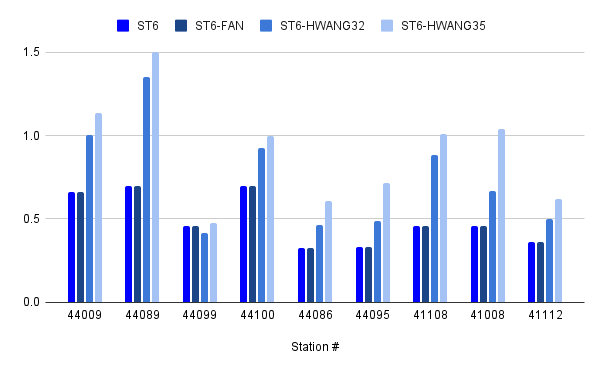
For Florence (2018), root-mean-square errors for predictions of significant wave heights at nine NDBC buoys, with comparisons for alternative settings for the ST6 physics.
Similarly to Gustav, the root-mean-square errors were smallest for the default ST6 physics, and they increased for alternative settings. Due to this, we can confirm our recommendation for SWAN users to choose the base ST6 setting.
Recommendation
We recommend that SWAN users (and ADCIRC+SWAN users) should adopt the ST6 physics in their storm simulations. Users will need to perform their own validations to feel confident in the performance of their models. But our results show that the ST6 physics can lead to more-accurate predictions of significant wave heights in storm simulations.