

Category Archives: Models
Seminar: Old Dominion University
Conference: Oil Spill Forum 2012
Seminar: Lakeway Men’s Breakfast Club
Troubleshooting for SWAN+ADCIRC
Updated 2016/08/02: Added the issue 5.
As we gain more experience with SWAN+ADCIRC, we have noticed a few minor issues with respect to actually running the coupled model. I have listed a few of them here, and I have described how to fix (or at least work around) each problem. Hopefully this page will be useful to new users of SWAN+ADCIRC.
This page will be updated as we encounter new issues. If you encounter an issue that belongs on this page, then please let me know. We want all simulations to step right along:

1. The pre-processor adcprep was not compiled for use with the coupled SWAN+ADCIRC.
This is a tricky error to debug when you first encounter it, because the code will write the following error message:
Input file missing
into either the screen output or the Errfile within each sub-directory. However, it is likely that all of the input files will be present in the run directory, including the SWAN input files (fort.26 and swaninit).
Seminar: AWMA Central Texas Chapter
Hurricane Gustav (2008) Waves and Storm Surge: Hindcast, Synoptic Analysis, and Validation in Southern Louisiana
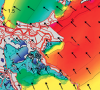 Hurricane Gustav (2008) made landfall in southern Louisiana on 1 September 2008 with its eye never closer than 75 km to New Orleans, but its waves and storm surge threatened to flood the city. Easterly tropical-storm-strength winds impacted the region east of the Mississippi River for 12-15 h, allowing for early surge to develop up to 3.5 m there and enter the river and the city’s navigation canals. During landfall, winds shifted from easterly to southerly, resulting in late surge development and propagation over more than 70 km of marshes on the river’s west bank, over more than 40 km of Caernarvon marsh on the east bank, and into Lake Pontchartrain to the north. Wind waves with estimated significant heights of 15 m developed in the deep Gulf of Mexico but were reduced in size once they reached the continental shelf. The barrier islands further dissipated the waves, and locally generated seas existed behind these effective breaking zones.
The hardening and innovative deployment of gauges since Hurricane Katrina (2005) resulted in a wealth of measured data for Gustav. A total of 39 wind wave time histories, 362 water level time histories, and 82 high water marks were available to describe the event. Computational models – including a structured-mesh deepwater wave model (WAM) and a nearshore steady-state wave (STWAVE) model, as well as an unstructured-mesh “simulating waves nearshore” (SWAN) wave model and an advanced circulation (ADCIRC) model – resolve the region with unprecedented levels of detail, with an unstructured mesh spacing of 100-200 m in the wave-breaking zones and 20-50 m in the small-scale channels. Data-assimilated winds were applied using NOAA’s Hurricane Research Division Wind Analysis System (H*Wind) and Interactive Objective Kinematic Analysis (IOKA) procedures. Wave and surge computations from these models are validated comprehensively at the measurement locations ranging from the deep Gulf of Mexico and along the coast to the rivers and floodplains of southern Louisiana and are described and quantified within the context of the evolution of the storm.